1. Introduction
he domestic prices are determined from the information on international prices and the tariff rates. Since the price variations accounted for here are trade and tariff driven, it would be interesting to know how domestic prices of traded goods are determined in the local market when the tariff rates change. Pakistan, being an economically small developing country, plays the role of a price taker in the global trade sector. Thus in analogy with other small open economies, the determination of domestic prices of traded goods in Pakistan would look as follows:
i wi i P =P (1+t )(1)rate of tariff (which is also exogenously determined as it is fixed by the government). This is shown in the following set of equations.
) t (
It can be inferred from equation (3) that given exogenous world price, the absolute change in the domestic price depends upon the international price times the tariff change. Taking log on both sides to linearize equation (3) we have;
) t (1 dlnP dlnP i wi + = (4)For simplicity reasons, here we would allow the relaxation of two strong assumptions. Firstly, there are unified products and one tariff line for imports of the same product for all countries. In this way, we are indeed relaxing the Armington assumption [Lloyd, J. P. et al. (2006)] of differentiated products with respect to their various points of origin or production (countries). Secondly, it is further assumed that the goods have similar prices throughout the whole country. See Table 1 for the summary of the percentage difference between the domestic prices of two goods in major cities of Pakistan 1 .
Here Pi and P wi are the domestic and world prices of the traded goods i respectively, and ti is the rate of tariff applied on traded goods. If the international price is exogenously determined, then the change in the local price would be established by the given change in the Though, in developing countries, this assumption may not hold in its entirety for a variety of reasons such as irregular market structures, information unevenness, etc. Nevertheless, in the case of Pakistan, owing to sea access and a relative good communication and transportation infrastructure, as well as developed markets in urban sectors, equation ( 4) can be a reliable exercise to determine the absolute price changes caused by a change in tariff.
2. II.
3. Data
The main sources of data are FBS' (Federal Bureau of Statistics) book '50 years of Pakistan in Statistics' all volumes and FBS online statistics portal 2 ; online datasets of Federal Board of Revenue (FBR), Pakistan, a public sector organization formerly known as Central Board of Revenue responsible for collecting all types of tax revenues and framing national tariff policies 3 ; Food and Agriculture Organization (FAO) online datasets. Due to the unavailability of straight forward data on tariff rates on the two goods, the appropriate data has been calculated from available statistics before using in the study. The detailed description on the calculation and quality of data used in the study is provided in the following paragraphs. Following paragraphs present the issues related to the quality and availability of the data used on the domestic and international prices of the two selected goods.
The data on the import tariff per ton on the two goods is not available in a straight forward fashion instead the information on total tariff revenue collected from various commodity groups is available from the Federal Board of Revenue (FBR) for the years from 1992 to 2005. Amongst, the provided selected commodity groups are fruits, nuts and vegetables; tea, coffee and spices; milk, butter and cheese; animal and vegetable oil; edible cereals and vegetables; tobacco; fuels and oils; sugar and confectionary; and meat, fish and other preparations. The two goods, wheat and milk, selected for the present study fall in "milk, butter and cheese" and "edible cereals and vegetables" groups. The tariff per ton on each commodity group is calculated by dividing the total yearly tariff revenue in PKR for 1992-2005 by the total import (C.I.F) quantity in tons of all varieties of goods in the respective commodity group. For example, the tariff per ton in PKR on the commodity group of milk, butter and cheese is calculated by dividing the total tariff revenue in PKR collected from the commodity group by the total sum of the import quantities in tons of milk, butter and cheese. See Table 2 for summary of the information. Since milk and wheat are the most dominant traded goods in the above two groups therefore the calculated average commodity-wise tariffs may also apply to the individual goods.
Table 3 presents the real world tariff for some years acquired from the WTO online data sets on the two commodities 4 . International prices are taken from the FAO online dataset and are presented in the following table 4. Source : Food and Agriculture Organization (FAO) online data set 5 The domestic prices of selected goods are taken from FBS' 50 years of Pakistan in Statistics (from 1992 to 2005) 6 and are the averages of the prices in major cities of Pakistan. The average variation in the domestic prices of goods across major cities of Pakistan is trivial so these prices can best reflect the domestic prices in Pakistan in general. See following Table 1 above.
The domestic prices from 1997-2005 are taken from the statistical year book 2006 published by FBS. All prices have been taken in local currency (PKR) per ton. The calculated tariff per ton is then added to the international prices to determine the domestic prices.
4. III.
5. Failing
The approach is based on the specifications of Porto (2003, 2006) to correct some of its methodological inaccuracies. Porto (2003) implicitly treated the import tariff rates as determined in the system which is against the fact that the trade policy of any country introduces the tariff rates on import of various commodities from prices on the international prices and the tariff rates. Resultantly, it produced estimated domestic prices which may not be accurate so cannot be relied for further policy making.
In present study this failing has been proved and suggested that the domestic prices can be computed instead of being estimated by exercising the simple addition of information on import tariff per ton to the international prices of the two goods. Following paragraphs show how the failings may be corrected and the calculated domestic prices reflect better approximation of domestic prices rather than the estimated domestic prices.
As an initial step, the domestic prices of wheat and milk are estimated using OLS Least Squares Method. Following section provides a detailed discussion on the regression methodology, functional form and the results.
IV.
6. Regression
The domestic prices of wheat and milk are estimated using real tariff rates available from WTO online dataset. The functional form of the regression equation is the natural log to linearize the price equation 3 to the form of equation 4. The regression results are significant and reliable as indicated from the large t-and f-values and their significance near to zero chance of error. Fairly large R2 indicates the overall satisfactory coverage of the regression analysis. (Table 2).
.37
Slightly large value of the constant indicates that there are some factors which affect the domestic prices of milk and wheat other than the tariff rates. However other values and the positive signs of the coefficients are in congruence with the expected and hypothesis.
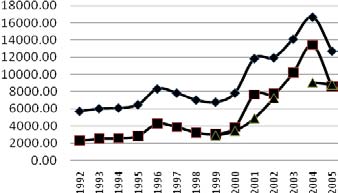
The calculated domestic prices on average tariff rate are compared with the estimated domestic prices at average tariff rate and the calculated domestic prices at the real world tariff rate. 7 The calculated prices at average tariff rate are found closer to the calculated domestic prices at real world tariff rate than the estimated domestic prices.
This indicates the methodological error in Porto (2003) 8 who took the estimated domestic prices instead of calculated prices. The Figure 1 (wheat and milk estimated and calculated domestic prices) confirms that the average tariff rates calculated on various commodity groups are also applicable to the individual commodities selected in the study. out of the system. Porto (2003) estimated the domestic
7. Wheat (PKR per ton) Milk (PKR per ton)
Estimated domestic prices at calculated Tariff Calculated domestic prices at calculated Tariff Calculated domestic prices at real world tariff The prices taken as an indicator of the domestic prices of milk and wheat are not the estimated ones instead they are the calculated ones obtained by adding the tariff per ton to the international prices.
V.
8. Conclusion
Estimating the domestic prices of traded goods in presence of international prices and tariff rates may not be a good approximation since the two independent variables are exogenous and determined out of the system. Therefore the failings in the past studies may be corrected by simply adding the international prices to tariff rates to determine the domestic prices of the goods. It has been attempted here to correct this flaw by using information on the prices and tariff rates of milk and wheat for Pakistan.

| 1992 | 1994 | 1996 | 1998 | 2000 | 2004 | |
| % | ||||||
| Wheat flour | -0.244211 -0.7886 -0.5986 -1.9057 -0.2967 -0.2348538 | |||||
| Milk | -1.727605 -1.711 | -1.2273 -1.1534 -1.2862 -0.7658772 | ||||
| Import (Tons) Total Revenue | Tariff per ton | Import (Tons) Total Revenue |
| (PKR)* | in PKR** | (PKR) |
| Years | Wheat | Milk |
| 1992 | 7951 | 3649 |
| 1993 | 9008 | 4036 |
| 1994 | 10256 | 4674 |
| 1995 | 11280 | 4720 |
| 1996 | 12428 | 6004 |
| 1997 | 13595 | 7408 |
| 1998 | 14953 | 7231 |
| 1999 | 15620 | 7694 |
| 2000 | 15906 | 8244 |
| 2001 | 16057 | 7871 |
| 2002 | 16525 | 8825 |
| 2003 | 16525 | 9150 |
| 2004 | 16800 | 10696 |
| 2005 | 17000 | 11126 |
| Coefficients | Standard Error | T | F | R 2 | ||||
| Constant International | Constant International | Constant International | ||||||
| price and | price and | price and | ||||||
| Tariff | Tariff | Tariff | ||||||
| Wheat 3.942 | .608 | .678 | .080 | 5.812 | 7.579 | 57.445 | 0.827 | |
| (0.000) | (0.000) | (0.000) | ||||||
| Milk | 6.096 | .361 | 1.362 | .136 | 4.477 | |||
| ( | ||||||||
| Wheat | Milk | ||||
| Estimated | Calculated Prices | Calculated Prices | Estimated | Calculated | Calculated |
| Prices | at average Tariff | at actual tariff | Prices | Prices at | Prices at |
| average Tariff | actual tariff | ||||
| 1992 | 2303.19 | 5710.44 | 18198.05 | 15372.38 | |
| 1993 | 2512.14 | 6020.14 | 11549.63 | 13043.77 | |
| 1994 | 2564.06 | 6095.50 | 29086.18 | 18210.46 | |
| 1995 | 2835.30 | 6479.90 | 14966.69 | 14324.13 | |
| 1996 | 4274.04 | 8317.06 | 13760.75 | 13895.92 | |
| 1997 | 3874.86 | 7835.60 | 16228.91 | 14749.33 | |
| 1998 | 3237.58 | 7024.46 | 17524.88 | 15164.46 | |
| 1999 2893.62 | 3054.84 | 6780.59 | 21909.05 | 18106.10 | 15344.27 |
| 2000 3417.45 | 3874.23 | 7834.82 | 47965.89 | 38503.78 | 20152.62 |
| 2001 4885.09 | 7657.62 | 11857.50 | 25368.37 | 22506.73 | 16599.05 |
| 2002 7216.55 | 7751.85 | 11946.03 | 28339.09 | 27072.45 | 17744.49 |
| 2003 | 10189.22 | 14107.03 | 44670.53 | 21263.79 | |
| 2004 9040.87 | 13416.13 | 16676.47 | 31543.21 | 29771.98 | 18364.43 |
| 2005 8798.66 | 8592.59 | 12718.04 | 36635.98 | 34835.70 | 19436.73 |