1. INTRODUCTION
akistan is a fourth largest producer of cotton in the world and has basic structure of textile and in the Asia Pakistan are the eight largest producers of textile commodities. 30 % population of Pakistan is working in the textile and creates employment for 15 million peoples. Pakistan has only two textile mills at the time of independence but by the time progressed gradually at this stage only due the fertile land and infrastructure favorable to that sector and technology improvement. . 56% exports of Pakistan are depends on this sector. Bulk of textile products is exported in the world from Pakistan to Other countries. Srilanka, Bangladesh turkey growing up by the time in this sector. Affordable prices and quick supply of gas, electricity, water, petrol and diesel are main factors so trade development authority of Pakistan (TDAP) decided to grow the exports so make the environment in which these factors should to be affordable and reachable. United state of America is the largest market of our textile and the major share of our textile goes to America because our marginal share in 1970 was 0.08% but in 1997 only 1.0% increase in our textile marginal share. Faisalabad, Gujranwala and Jalalpur Jattan are the major cities for weaving clothes because of suitable infrastructure. According to annual report by state bank of Pakistan (SBP), the sector has strong implications on socio-economic conditions of the country given its role P ebruary
2. F
The lacing together of threads and yarns to form cloth has developed over thousands of years of discovery and experimentation. The origin and development of woven cloth is closely tied to the history of mankind. Thousands of years ago we developed the skills necessary to turn the raw materials around us into cloth for clothing and shelter. Production of fabric is original means of weaving, two distinct set of yarn and threads are interlaced to form fabric or cloth. For making cloths/fabric using looms in which warp thread and weft thread are filling. Cloth generally woven on looms which hold the warp and weft thread. Early looms required two people to create the shed, and one person to pass through the filling. Early looms wove a fixed length of cloth but later ones allowed warp to be cut out as the floor progressed. There are 90,000 looms are in operation in which 30,000 are working and 60,000 loom on yarn. There are three different sectors in weaving sector, integrated, independent weaving units and power looms unit and different types of looms hand looms, power looms and mill weaving In concept, McKay's work remains at the moment the last word on the subject of comparative efficiency in weaving in Bangladesh.
in employment generation. Devastating floods affected textile production in Pakistan in FY11. During second half of the year, surge in global cotton prices provided earning opportunities in the form of unprecedented high export prices, which in turn induces production activities. The crop loss in Pakistan and Australia, unfavorable weather in china, declining US inventories and exports cap by India also surged prices. Around 12% of Pakistan's total fabric exports are destined for Turkey. The fabric export to Bangladesh may continue to support this sector in Pakistan.
3. II.
4. LITERATURE REVIEW
The economic history review in (AUG, 2002) approximately hundred thousand handloom weavers surviving in south Asia due to the main focus on labor intensive technology. 1 Economic and political weekly (AUG, 1998) more new tools and methods in textile weaving created the problem for the old institutional set-up. Labor demand decreasing approximately 7 workers out of 10 were hired because of capital intensive technology and females in the family are not able to work outside which was huge loss so the fly shuttle installed on small scale, old methods are more beneficial from new processes. 2 All 3203) and total growth in world is 13%. And world's growth rate in production of clothes is about 5%. 3 Another study in Pakistan Economic Survey (1999-2000) In Pakistan's textile industry highlighting is on the spinning activity. Major portion of thread produced of good quality is exported rather than utilize large part of it for produce high value-added products like fabric, or clothing. This is an important structural weakness of our textile industry. This thread is imported by other countries like Japan, Hong Kong and South Korea who have well flourish textile industry change it into high value-added products and get much higher prices in international market. These countries do not cultivate cotton, but they have well-established textile industry because they have invested in modern manufacturing technology as well as in skilled staff. Their competent methods of production have enabled them to defeat the handicap of imported thread. But in Pakistan textile industry make decline due to be deficient in of investment and well qualified workforce in spite of having advantage of cotton and labor. 4 Pakistan is the major textile product supplier in the world market with share (30% yarn trade, about 8% McKay (1984) has afterward used data from Wasow et al. in estimate relative competence of HL and PL techniques on the basis of the addition of internal rates of return (IRR) and household resource cost (DRC). 6 According to the Pakistan textile mills association (PTMA) the cotton prices in Pakistan changing in every year increasing or decreasing every year data shows (2002-2011)
5. METHODOLOGY
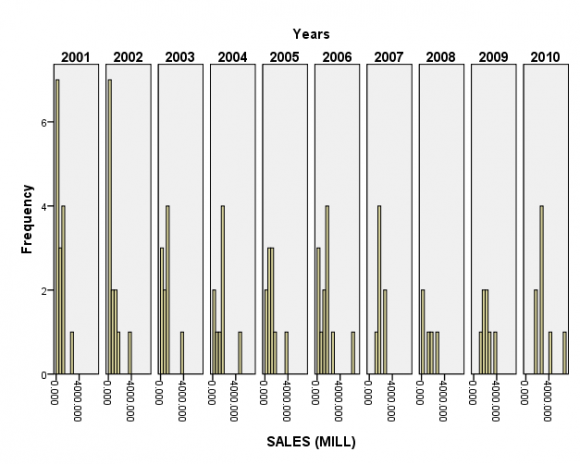
Secondary data of Textile weaving has been used in this research from Karachi stock exchange. Different tests have been applied for getting the appropriate result. Histograms are showing that in which year sales and profit after tax are on their maximum level. Least significant difference test (LSD) is showing the difference of one year mean from the other year's means. ANOVA is used for comparing the means of different variables from year 2001-2010. Multi linear regression has been used by taking the Sales as dependent by taking paid up capital, no of share, equity, Profit after tax, bank charges and total asset as independent variable. For profit after tax (dependent) sales, paid up capital, no of share, equity, bank charges and total asset are being used as independent variable. In this line chart, there are six variables. This graph is showing that profit after tax and before tax has zero or less than zero mean throughout the decade.
Sale is increasing then decreasing in the mid it's again having a boost then in 2007 it's decreasing, from 2008 line is moving upward.
The graph is showing that paid up capital is increasing then in 2002 it's increasing rapidly in 2004 it's decreasing and so on its continuously increasing and decreasing till the end of decade. It is interesting that equity is also changing according to paid up capital. This area chart is showing the trend of sale. It's increasing but in 2004 and 2007 it's decrease for one year. Sale is on its peak in 2009 and 2010 but interesting thing is that although company are selling their in products in millions but they are showing their profit after tax and before tax zero or less than zero. May be they are not showing their real profit because they don't want to pay tax or they want to get tax rebate.
6. Years
7. Hypothesis
Sales:
H 0 :u2001=u2002=u2003=u2004=u2005=u2006=u20 07=u2008=u2009=u2010 H 1 : At least one mean is significantly different Profit after tax:
H 0 :u2001=u2002=u2003=u2004=u2005=u2006=u2007=u2008=u2009=u2010H 1 : At least one mean is significantly differentAs the p-value of sale, paid up capital, bank charges and no. of share is less than 0.05 so it means that null hypothesis (H 0 ) will be rejected and H 1 will be accepted. It means that at least one mean is significantly different. But p-value of Total asset, profit after tax, profit before tax, and equity is greater than 0.05 so it means that we will accept H 0 and reject H 1 . (1995-96). 9. Textile Industry-Special Report (1995). Economic Review7 ,71 -7
8. LSD
9. VII. Conclusion
At the start of decade companies in this sector were in many numbers but with the passage of the time they were started to shut their businesses. But in the mid so many companies came into this sector but when the electricity crisis started in the past, they again shut their businesses. The same thing is happened with profit of companies. At start companies were earning profit respectively high from the other years, then it's started to decline and in the mid of the decade profit were on their peak level and then its again started to fall till the end of the decade. Sale was high in start but then it decreased and remains same till the end. The one thing which is interesting that companies were selling their products in million but they were almost on breakeven point that means they were on no profit level. There is almost monopoly in this sector because only 10 to 20 companies are there in this sector but almost half of sale and total asset were in hand of 2 or 3 companies.

| a. Dependent Variable : Profit After Tax | ||||||||||||||
| Backward method is used for this model, as | ||||||||||||||
| model is showing that total assets, equity and sales are best describing the profit after tax. | VI. | Sales as dependent | ||||||||||||
| ANOVA d | ||||||||||||||
| Model | Sum of Squares | df | Mean Square | F | Sig. | |||||||||
| ANOVA d | ||||||||||||||
| SALES (MILL) 1 Regression Residual Model 1 Regression Total Residual | 516796.106 Multiple Comparisons 5 103359.221 460727.148 90 5119.191 Sum of Squares df Mean Square 139928351.421 5 2.799E7 977523.254 95 24520384.943 90 272448.722 | 20.191 F 102.719 95% Confidence Interval a .000 Sig. a .000 | ebruary F | |||||||||||
| Years 2 | Years Regression Mean Difference 516193.283 Total 164448736.364 | Std. Error 4 95 | Sig. 129048.321 Lower Bound 25.456 | Upper Bound b .000 | ||||||||||
| 2007 2 | 2001 Residual Regression | 1183.201267 461329.972 * 139909491.789 539.659248 91 4 | .031 5069.560 3.498E7 | 110.39419 129.708 | 2256.00835 .000 b | |||||||||
| 2002 Total Residual | 1100.801385 977523.254 * 24539244.574 552.709889 95 91 | .050 269662.028 | 2.05049 | 2199.55228 | ||||||||||
| 3 | 2010 Regression -1242.790250 515672.002 * Total 164448736.364 610.175196 3 95 | .045 171890.667 -2455.77839 34.240 | -29.80211 .000 c | |||||||||||
| 2009 3 | 2001 2002 Residual Regression | 1501.418838 1419.018956 * * 461851.252 139885429.438 539.659248 552.709889 92 3 | .007 .012 5020.122 4.663E7 | 428.61176 320.26806 174.643 | 2574.22592 2517.76985 .000 c | |||||||||
| 2003 Total Residual | 1157.991671 977523.254 * 24563306.926 581.002998 95 92 | .049 266992.467 | 2.99594 | 2312.98741 | ||||||||||
| Total | 164448736.364 | 95 | ||||||||||||
| Multi linear regression is used for this test. Overall model | Profit after tax is taken as dependent variable where as | |||||||||||||
| is significant. | paid up capital, equity, bank charges, total asset and | |||||||||||||
| 2010 Multi linear regression is used for this test. 2001 2425.991517 * 516.150352 2002 2343.591635 * 529.780429 sale are independent variable. .000 1399.91858 .000 1290.42300 PAT = b 0 +b 1 paid up capital+b 2 Equity+B 3 bank Overall model is significant. charges+b 4 sale+b 5 Total asset a Coefficients Coefficients a | 3452.06446 3396.76027 | |||||||||||||
| Standardized | ||||||||||||||
| 2003 | 2082.564350 Unstandardized Coefficients * 559.234804 | .000 | 970.84235 Coefficients Standardized 3194.28635 | |||||||||||
| Unstandardized Coefficients | Coefficients | |||||||||||||
| Model | 2004 | 1614.120694 | * | B | 572.876682 Std. Error | .006 | 475.27954 Beta | t | 2752.96185 Sig. | |||||
| Model | B | Std. Error | Beta | t | Sig. | |||||||||
| 3 | 2005 (Constant) | 2014.508250 | * | .567 | 559.234804 11.448 | .001 | 902.78625 | .050 | 3126.23025 .961 | |||||
| 3 | (Constant) | 290.808 | 74.411 | 3.908 | .000 | |||||||||
| 2006 TOTAL ASSET (MILL) | 1550.777417 | * -.103 | 538.123941 .012 | .005 | 481.02243 -1.414 | -8.745 | 2620.53241 .000 | |||||||
| TOTAL ASSET (MILL) | .507 | .062 | .534 | 8.140 | .000 | |||||||||
| 2007 EQUITY (MILL) | 1242.790250 | * | .234 | 610.175196 .033 | .045 | .950 | 29.80211 | 7.148 | 2455.77839 .000 | |||||
| 2008 SALES (MILL) (BANK) / FINANCIAL CHARGES | 1832.475050 | .060 6.335 | .011 | 1.077 | .779 | 5.630 .387 | .000 5.880 | .000 | ||||||
| PROFIT AFTER TAX | 3.197 | .526 | .246 | 6.078 | .000 | |||||||||