1.
remote village via the mobile services. Increasing awareness of education in India bring many rural youth to nearby towns to pursue their studies.Past research related to mobile phone usage reveals that mobile usage pattern varies from one group to another.Hence, by considering these issues relating to the usage pattern of different age-groups, researchers have attempted to carry out a study of rural youths who are pursuing graduation either in management (Bachelor of Business Administration) or computer science (Bachelor of Computer Applications) from an adjacent town named Visnagar in Gujarat State (India).
2. II. LITERATURE REVIEW
In addition, study carried out of Bianchi and Phillips also pointed out that age played a significant role in determining the total time spent on the mobile phone usage. Older respondents were found to use the mobile phone more for business purposes while younger students used it to socialise. Further findings from their study revealed that younger users were
3. 2011
May ural India is expected to fuel the growth in mobile phone services in the coming years. Mobility,accessibility and convenience of communication have made it an unavoidable part of life. As India is still struggling for smother infrastructure, mobile phones can be used to deliver content and services that can help cultivate inclusive growth in India by digitally empowering citizens across all cross-sections of society, both urban and rural. The next mammoth growth in subscriptions will come from semi-urban and rural areas. The rural segment services can benefit selling and procurement of information and support for farm commodities, educating farming community on best practices, delivery of healthcare and education to
4. R
Several parameters are significantly related to the patterns of mobile phone use. Research carried out in the past revealed the associations of demographic factors such as sex, age, and psychographic factor like self-esteem with mobile phone use. Thus the following review of literature focuses mainly on the relationships between personal factors and young students' from rural area.Researchers attempted to find out previous research on youth and adolescents in Indian context but much research related to it has not been carried out.Beanchi & Phillips (2005) states that technical applications like MP3 players attracts more male users while for female users mobile phones are mere tool of mingling with friends and relatives . Bianchi and Philips (2005) also found that females use the mobile phone for social reasons while males called more people on a regular basis. Bianchi and Philips assumed that males used their phones frequently for business purposes and not for socialising. However, Bianchi and Philips did not find any significant relationship between gender and the patterns of mobile phone (i.e. SMS usage and time spent). Moreover the study predicted that gender did not predict overall use of the mobile phone. more obsessed to the mobile phone use.
Ito and Okabe (2004) also came out with similar findings for their study on Japanese adolescents. Japanese adolescents were preoccupied with their mobile phone because they had flexible time, vigour and mobility compared to older users. Adolescents used the mobile phone for emotional and social communications specifically in building and sustaining relationship with friends (Ling & Yittri, 2002). Furthermore, adolescents viewed the mobile phone as an outstanding, prominent and liberating personal tool that allowed them to have a better social position in life. In addition to this, adolescents' level of self-esteem and its influence with mobile phone usage has also been studied by them. Individual with high self esteem are understood to use less of the mobile phone for communication compared to those with low self esteem. Low self-esteem users were assumed to use the mobile phone for reassurance and not mainly for social purposes. Ling (2001) in his study found that young adult men spent more time on the mobile telephones compared to adolescent girls. Men reported to begin spending more time in their late adolescence and peaks in the mid 20's. Their high level of use extends into their early 30's after which their length of usage drops. In addition to this, Ling also noted that although women spend more time on their mobile phones during their late adolescence, their length of use is lower than the men as they prefer more face to face communication compared to their male counterparts. One such research also stated that young mobile phone users tend to demonstrate appropriate monthly expenditure. School-going mobile phone users in Europe spent approximately 25 Euro a month on their mobile phone (Clonen, 2002). Another study revealed that a large proportion (66%) of Australian adolescents preferred to use the mobile phone pre-paid system (Australian Psychological Society, 2004). This system allows adolescents and their parents to monitor and control the mobile phone cost. Furthermore, more than half (57%) of adolescents claimed that they were very careful in spending money on their mobiles. However, a small number (38%) of them reported that they tend to overspend on their mobile phones due to peer expectation of receiving a reply SMS (Short Message Service) from them. A considerable proportion (13%) of adolescents even had to buy additional credit without their parents knowing and 8% borrowed money from their parents to pay their bills.
Mobile phones are equipped with various features that enable communication and entertainment for its young users. Ling (2001) clearly states that Previous study found that the most popular feature used among young users were text messaging. Nurvitadhi (2003) in her study of mobile phone usage of adolescents in Japan and USA found that a large proportion (69.53%) of Japanese adolescents preferred using the text messaging service while American adolescents (35.5%) favored the game features of the mobile phone. Japanese adolescents (40.21%) were also found to use more of MP3 (MPEG-1 Audio Layer 3) features of mobile phones as compared to other features. Ling (2001) in his study on female adolescents and young adult men found that female adolescents sent more text messages compared to adult men. Ling further noted that there is a transition periods in patterns of mobile phone use among adolescents. Text messaging was found to be gradually replaced by voice calling when the adolescents were in their early 20's. Supporting Ling's findings, Lie (2004) found that there is a certain pattern in mobile voice telephony among young adults. Men were seen to use their mobile phone more compared to women. They additionally make more business oriented calls since they are more often in managerial positions. On the other hand, women used the fixed line telephony more than men do to maintain their social network and other social co-ordination task. Women choose the fixed line telephony to socialize because it is more cost effective compared to mobile phones. Similar findings were seen in a study investigating patterns of mobile phone use amongst secondary-school students (Madell & Muncer, 2004). Zulkefly and Baharudin (2009) found that age of the students also played a factor in determining patterns of using the mobile phone. Younger students were found to be more inclined to use the additional features of the mobile phone such as, MMS and GPRS, while older users preferred to use the conventional voice calls. The amount of time spent on the mobile phone and enthrallment with the features of the mobile phone would make some students easily more attracted and obsessed with the mobile phone. Females used more of the SMS feature while boys were more interested with other technological features of the mobile. Zulkefly and Baharudin's study also revealed that students frequently contacted their friends more compared to their parents. IV.
5. III.
6. Objective of the study
7. RESEARCH METHODOLOGY
Exploratory research design was employed to carry out this survey. For the collection of primary data, well structured questionnaire was used which was checked by the subject experts and then it was pretested to avoid confusing and duplicated questions. Scientific method (according to the proportion) was used to determine sample size of the survey work. Firstly, researchers estimated the average sample proportion of who possessed mobile phone in Visnagar area. Then a sample size were calculated by considering confidence level of 95%, a margin of sampling error (or precision) of ± 5 %, Thus, the final sample size was calculated to be 196. Thus, the study attempted to attain sample reliability within ± 5 per cent margin of error at the 95 % confidence level. As the population was heterogeneous (students were studying in various classes) researchers apply stratified sampling method. To apply Stratified Sampling Method, students were classified according to their class (First Year, Second Year &Third Year) then from the classified groups, with the help of random number table sample were drawn according to the class size. The Primary data was collected through structured questionnaire in which two types of questions closedended and openended were used. None rate of response rate were found to be 12% so to reach to 196 respondents as researchers had undertaken the study of 223 samples. Secondary data was collected from journals, magazines, reports, research studies, government publications, professional publications, research organizations and websites.
V.
8. ANALYS
Cross tabulation mentioned in Exhibit-1, showcases Gender and use of mobile phone among 196 students. A Mere, 4 % of the students did not use mobile phone which indicates the growth in the usage of mobile phones amongst students commuting from rural areas. The survey also revealed that majority of the students came from middle class families. 119 college students stated that their family's monthly income ranged between Rs.5000 to Rs.15, 000 Exhibit 1 : Gender & Class v/s Use of mobile phone A very remarkable finding of the study revealed that 62.8% of the college students' monthly expenses were less than Rs.100. H01 mentioned below was framed so as to check association between monthly income of students and the expenses incurred by students on mobile phone (especially for recharging the prepaid services, internet usage, subscribing to caller tunes, etc.) H01: There is no significant association between the family's monthly income and the monthly expenses of the undergraduate management and computer programme students. In Exhibit.2 chi-square asymptotic significant value is 0.09 which implies that monthly family income and expenses are not strongly associated with the family monthly income, since the degree of association is only 21.5 %.
Exhibit 2 : Family's monthly income vs. Students' monthly Expenses Male Students usually spend more as compared to their counterparts. In rural areas, parents rather prefer to restrict pocket money to a few rupees only. Researchers H02: There is no significant association between the Gender and the Monthly expenses of the undergraduate management and computer programme students.
9. Exhibit 3 : Gender vs. Monthly Expenses
Here, as per Exhibit-3 the Chi-square asymptotic significant value 0.139 is greater than p-value (i.e. 0.05). Hence, there is no significant association between the Gender and the monthly expenses of the undergraduate college students. Symmetric measure for these two variables is 0.189 which indicates that the degree of
10. Cross-Tabulation
11. ES
wanted to find out whether Gender and Monthly expenses on mobile phone were associated or not. Hence, the H02 was tested. association between Gender and monthly expenses are only 18.9%.
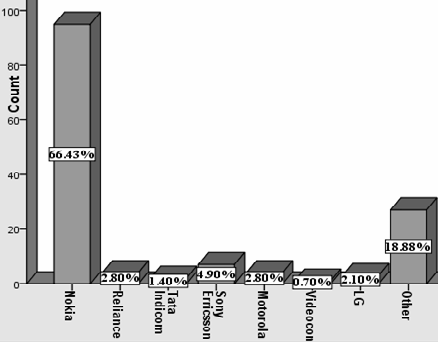
12. a) Preferred Brand of Mobile Handsets
Study reveled that there is strong brand awareness and usage of Nokia mobile phones in rural areas as 66.43% of the undergraduate college students used Nokia mobile handsets while only 18.88% of the students used other brands.
To test the hypothesis Binomial test has applied. Binomial Test is the available statistical tool which tests the proportionality of the variable.
13. : Brand Preferences of Mobile Handsets
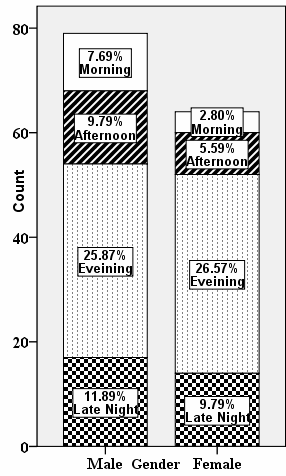
Exhibit-4 shows that Binomial Test asymptotic significant value is 0.000 which is less than 0.05 (p-value).Thus; there is no statistical evidence to accept the null hypothesis. But if we look at the observed proportion (i.e. 0.68) which is significantly higher than the test proportion (0.5), which demonstrate that more than 50% of the college students use Nokia as their mobile handset. The same can in Fig 1 Most of the respondents used mobile phones during evening. Moreover 62.8% of the students replied their monthly expenses were less than Rs.100. Exhibit .6 : Use of Text Messaging Services ( SMS) Exhibit-6 indicates that t-test sig. (2-tailed) value is 0.000; hence H04 cannot be accepted. On Further analysis it was revealed that 60.7% female students and 39.3% male students sent SMS just once in a day while 66.7% male students and only 33.3% agreed to be using SMS-tool upto five times a day. Hence, it can be generalized that male students send more text messages (SMS) than their female counterparts in rural area of Visnagar. This is the primary purpose for using a mobile phone. Female students rated it as a tool for personal safety as one can avail help of parents and relatives incase one is late in returning home in the evening or during the breakdown of the vehicles through which they commute to Visnagar town for their studies.
Analysis also reveals that more female students (56.5%) ranked Personal safety as number 1 as compared to the male students (48%). Moreover, 69% of the female students gave fifth rank to factor 'impressing people; as compared to male students (59% As mentioned in Exhibit 9; a majority of the respondents considered mobile as socialising tool so that they can be in touch with their friends and relatives. Students also opined that mobile phones are not just a communication tool but a wholesome entertainer. Study revealed that students considered mobile phones as a multipurpose gadget as they use it for listening to preloaded songs or for watching videos and using Alarmclock given in their mobile phone.
Exhibit .9 : Common Mobile Usage Pattern VI.
14. CONCLUSION
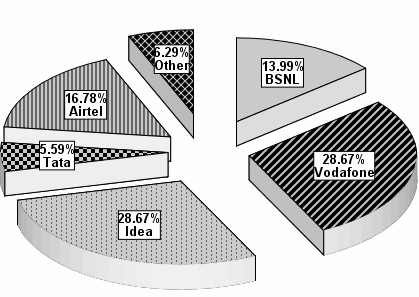
Mobile phone usage in the rural areas of Visnagar has been hugely accepted by students pursing their graduation. Data obtained from the study provided baseline information regarding usage patterns and preference for mobile handsets and service operators. Family's income and gender were not the influential factors in mobile phone usage as most of the students spend a meager amount of just Rs. 100 per month. An extremely strong brand preference of Nokia existed in this market which could be a learning lesson for follower brands like Sony Ericsson, LG and other Indian brands of Mobile handsets. The most used feature of the mobile phone was SMS and the most credible explanation for usage of SMS is that it's cheaper and students with limited financial resources can communicate effectively. These findings are consistent with previous study reported by Beanchi & Phillips (2005). Findings from the present study also showed that Male students send more text messaging than the female students. Idea and Vodafone have created a good image among the undergraduate management and computer students by providing good services.
15. VII . Managerial implications
The study can help mobile services operators and marketers in positioning their services effectively to the rural population of India. Research of this type is relevant as marketers are always in search of possible factors that may influence consumers of mobile services. The preferences of rural youths studied can be helpful for investigating influence of various parameters for effective positioning and promotion of Mobile handsets and mobile services. The study was carried out before Mobile Number Portability was introduced in India. If the same had been carried out in current context, brand preferences about service operators could have been more specific. Moreover, the findings of this study are very specific and could only be generalised to population with the same characteristics. Despite the limitations, the current study provides scope for new investigations to refine the understanding of mobile phone usage. Further research could investigate other underlying factors that exist within the rural population that could shape their mobile phone usage behaviour. In addition, the consequences of intense mobile phone use could be further explored in terms of aesthetic appeal (shape, colour, external features etc) and overall quality of service operators in India.
16. May

| Mobile Phone Usage Habits Of Students Commuting From Rural Areas To Nearby Town -An Exploratory Study | ||||||
| Of Visnagar (Gujarat -India) | ||||||
| 2011 | ||||||
| May | ||||||
| Chi-Square Test | ||||||
| ( Family monthly income vs. Students' monthly | ||||||
| Expenses) | ||||||
| Value | Asymp. Sig. | |||||
| (2-sided) | ||||||
| Pearson Chi-Square | 18.728 | 0.095 | ||||
| Contingency Coefficient | 0.215 | |||||
| (Symmetric Measure) | ||||||
| Chi-Square Test | ||||||
| ( Gender vs. Monthly Expenses) | ||||||
| Value | Asymp. Sig. | |||||
| (2-sided) | ||||||
| Pearson Chi-Square | 6.945 | .139 | ||||
| Contingency Coefficient 0.189 | ||||||
| (Symmetric Measure) | ||||||
| Do you use a mobile phone? | ||||||
| Yes | No | Total | ||||
| Gender | Male | 112 | 3 | 115 | ||
| Female | 76 | 5 | 81 | |||
| First Year | 56 | 3 | 59 | |||
| Class | Second Year 67 | 4 | 71 | |||
| Third Year | 65 | 1 | 66 | |||
| ©2011 Global Journals Inc. (US) | ||||||
| Binomial Test | |||||||||
| Category N | Obs. Asy.Sig. | ||||||||
| Quality of services | Prop. (1-tailed) | ||||||||
| provided by mobile operator | Good others | 164 24 | .87 .13 | .228a | |||||
| Binomial Test | Total | 188 | 1.00 | ||||||
| Category N | Obs. | Asy.Sig. | a. Based on Z Approximation | ||||||
| Prop. (2-tailed) | |||||||||
| Use of mobile phone | Nokia Others | 128 60 | 0.68 0.32 | .000a | |||||
| Total | 188 | 1.00 | |||||||
| a. Based on Z Approximation | |||||||||
| Mobile Phone Usage Habits Of Students Commuting From Rural Areas To Nearby Town -An Exploratory Study | ||||||||||
| Of Visnagar (Gujarat -India) | ||||||||||
| t-test 14.8 % of the students considered Features available while 12.5 % of the college students considered price, Statistics the most desirable factors while purchasing a mobile phone. | One-Sample Test Test Value = 4 (Multiple times a day) | |||||||||
| g) Common Usage Pattern | N | Mean | Std. D. | t | d.f. | Sig. (2-tailed) | Mean | 95% C. I. | ||
| Use of text messaging or SMS service | 188 | 2.97 | 1.192 | -11.867 | 187 | .000 | Difference -1.032 | Lower Upper -1.20 -.86 | 2011 | |
| May | ||||||||||
| 35 | ||||||||||
| For Personal safety Tool for Socialising For Information Access For Status To impress people Durability of Battery Appearance Price Additional features available Resale value Quality Service from the company Reason for Buying Mobile Phone Rank Second First Third Fourth Fifth N Percentage 102 0.154 33 0.05 83 0.125 98 0.148 28 0.042 125 0.189 61 0.092 Factors considered while phone purchasing a mobile Responses | Global Journal of Management and Business Research Volume XI Issue VI Version I | |||||||||
| Availability of service center | 37 | 0.056 | ||||||||
| Image of company | 54 | 0.082 | ||||||||
| User-Friendliness | 41 | 0.062 | ||||||||
| Total | 662 | 1 | ||||||||
| Exhibit .8 : Factors Considered While Buying Mobile | ||||||||||
| Phone | ||||||||||
| f) Factors Considered While Buying Mobile Phone | ||||||||||
| Exhibit 8 indicates that 18.9% of the students | ||||||||||
| consider Quality, 15.4% consider Battery Durability and | ||||||||||
| ©2011 Global Journals Inc. (US) | ||||||||||
| Common mobile usage pattern: | Responses | |
| N | Percentage | |
| For Staying in touch with friends /family | 167 | 30.8 |
| Shopping or paying bills | 8 | 1.5 |
| Accessing sports news and current affairs | 14 | 2.6 |
| For Purchasing tickets (movies, sports, etc) | 10 | 1.8 |
| For discussing study related matter | 118 | 21.8 |
| Clock and alarm | 86 | 15.9 |
| Check email and web browsing | 41 | 7.1 |
| Listen to music or radio and video ( pre-loaded) | 98 | 18.1 |
| Total | 542 | 100.0 |
| the | ||