1. Introduction
he adoption of management performance tools is presented in analysis as an enabling factor for SMEs to face the current challenges of an increasingly complex environment (Julien 2000), and also to help their own personal growth. Therefore, if the instrumentation of management constitutes a strategic issue for the viability of SMEs, the fact remains that there is still an unfavourable echo of the prescriptions of management tools. Part of the unfavourable echo however can be explained by criticisms made about management tools (Berry 1983;Moisdon 1997), but most especially the particularities of SMEs in relation to its organizational style and the profile of its leader given the central role he plays (Schmitt et al. 2002). In fact, the introduction of management measures will lead to resistance tendencies that must be taken into account because they condition the success or failure of the approach.
Since the second half of the 1980s, many studies have proven that traditional tools are inefficient. (Johnson and Kaplan 1987). They are primarily based on financial situations, with historical information, and not enough openness to the external world. The clarification they bring to managers is ultimately less relevant to help them make strategic decisions. Today, the cycle of management control has been completely enriched. The strategy and choice of management tools (balanced dashboard, ABC method, cost target, etc.) condition the process of management control and it is interesting to know the factors that predispose SMEs to adopt management tools, among which the best known is the dashboard.
Both in the field and as a research topic, one can see the legitimacy of the SME. In Cameroon, the National Institute of Statistics (INS) through its report on the 2016 RGE -2 revealed a strong increase of companies in the national territory, of the order of 123% compared to 2009 (between 2009 and 2016, we went from 93969 units to 209482 units). There is a predominance of Very Small Enterprises (SMEs) and Small Businesses (SB) with 98.5% units followed by Medium Enterprises (ME) with 1.3% and finally LE (Large Enterprises) with 0.2%. This enables us to confirm that SMEs constitute the major economic force of our country and therefore represent an undeniable factor of job creation. However, this legitimacy suffers due to the context in which it evolves. In fact, it faces the same challenges as large companies with different of resources and organization. Cameroonian SMEs are mostly family businesses with a high concentration of capital. Shares are constituted by family, tribal or friendly affinities, with a strong propensity of the shareholders' borrowed name (Wamba, 2001;Sangué-Fotso, 2011). The management style of a very small company is not very different from that of the medium seize company. In fact, the family greatly influences decision-making process, staff recruitment, and so on. The proprietor concentrates almost all power himself regardless of the type business. He relies on experience, or even empiricism to organize and manage his company. The results of the last general census of enterprises (GCE-2, 2016) suggest that Cameroonian SMEs suffer from a structural and organizational weakness that does not permit them to do effective bookkeeping in order to produce reliable financial statements, summary and give readability of the activity.
The management control tools, first and foremost, the dashboard was originally set up in large companies to cope with the complexity of management situations and to drive the overall performance of the company (Kaplan and Norton 1996). However, some authors (Epstein and Manzoni 1998; Mendoza and Bescos, 1999;Mendoza et al., 2002;Germain 2001Germain , 2004Germain and 2005)), stated that the use of the dashboard should be contingent, depending on the specificities of each company and not following a standard model. Chapellier (1994) proposes taking into account structural contingencies such as size, age, the degree of computerization of management and the nature of the activity; or the profile of the leader.
Given the particularities of SME and the more or less rational and standardized nature dashboards, including the BSC, a question emerges:
2. What are the determinants of the adoption of dashboards in the Cameroonian SMEs?
Our goal is twofold. On the one hand, determine the structural contingencies to the adoption of DB and on the other hand, behavioural contingencies. This article is structured around three axes. The theoretical framework and research hypotheses are first discussed. The methodological framework is then presented. Finally, the results are exposed and discussed.
3. II.
4. Theoretical Framework and
Research Hypotheses a) Psycho-cognitive logic in the adoption of management tools Contingent vision (Lawrence and Lorsch 1973;Mintzberg 1982) is undoubtedly important in identifying the determinants of adoption of DB. It introduces the notion of contextualization of management tools. An instrument would have different consequences for management decisions depending on the type of organization in which it is introduced (Moisdon 1997). However, in the context of SME and the central role played by its leader, it seems useful to address the theoretical anchoring by a cognitive logic.
Here we review the work of Lorino (2002) which shows that the management tool, as an instrument, has a practical impact only by its insertion in human activity. Two elements are generally involved in the mechanisms of psycho-cognitive appropriation of management tools. First, we rely on the work of Justin (2004), which puts forward the said "behavioural" approach of management tools. It shows that the tool is dependent on the actor and three types of intentions: strategic (conscious willingness to generate organizational performance), influence (the tool is chosen according to its persuasiveness or stakeholder orientation) and manipulation (acting on one's own interests or personal values) Secondly, the appropriation and use of a management tool will depend on the intrinsic characteristics of the individual and behavioural (Piaget 1998;Goffman 1991;Piaget and Inhelder 1998).
b) The management tools used by SMEs: the place of the dashboards Studies have shown that the management of SMEs is not totally intuitive. Thus, Fernandez, Picory and Rowe, (1994), through their study of 102 SMEs, have shown that there are a large number of management tools. They classify them into three groups: forecasting tools (plans and budgets), monitoring tools (dashboards) and analysis tools (management and financial accounting). According to Nobre (2001b), while carrying on a study on a sample 86 companies between 50-500 employees, points out that management tools such as the dashboard, budgets and gap calculation are widely used by the SMEs.
In the Cameroonian context, several studies (Djoutsa, Takoudjou and Simo 2013; Ngongang 2006Ngongang , 2010; Nyengue and Edimo 2003; Nimpa, Wendji and Wendji 2019), conclude that the most common CDG tools in SMEs are traditional (cost approach).
The place reserved for the dashboard in the management of companies remains quite controversial. Tool designers and many other authors (Epstein and Manzoni 1997; Kaplan and Norton 2001;Fernandez 2003), regard the dashboard as being a central tool, an alternative to the traditional budget system. Contrarily, authors such as Mendoza and Zrihen (1999)consider that the reporting cannot replace dashboard.Zecri (2000) adds to the debate and stated that it is impossible to run a business without budgets. Gray and Pesqueux (1993) adopt a compromising position, and put forward the idea that if the dashboard serves to follow the general objectives at the level of the head office, then it can be one tool among others, if it serves to monitor the day-to-day activities at the operational level, then it must be a central tool.
5. c) The factors influencing the adoption of DBs
Several studies have examined the link between the use of the dashboard and some contingent factors (Zian 2013). These factors can be classified in several groups such as structural, organizational and managerial or individual.
6. i. Structural factors of influence
Regarding the defining elements of the company, Nobre (2001a) conducted a study in France and concluded that the size of the company constitutes a contingency factor and reason for the use of the dashboard (DB). Several other authors in different contexts confirmed this insight, notably Lavigne (2002) on 282 Québec manufacturing SMEs and Van Caillie (2002) in an exploratory research conducted among 100 medium-sized manufacturing SME in Belgium; Hoque and James (2000), using a sample of 66 Australian companies. Larger organizations therefore have the performance measurement practices that are closest to those of the balanced dashboard (Jorissen et al. 1997, Germain 2004, Elhamma 2013, Ngongang 2013). The age of the firm represents also a contingency to management instrumentation (Mintzberg 1982). The ownership structure of the company or the family nature of the company can also constitute a significant contingency factor of the use of the dashboard (Lavigne, 1999) or a blockage to the establishment of the CDG (Meyssonnier and Zawadwki 2007).
With respect to environmental and contextual factors, several studies (Choffel and Meyssonnier2005; Chapman 1997 ;Fisher 1998;Hartmann 2000) suggest that uncertainty as well competitive environment will force organic structures that favour the search for external and non-financial information (Condor and Rebut 2008) to conclude that a company operating in a highly competitive industry will be more motivated to use management tools than one operating in a less competitive industry.
7. ii. Organizational and managerial factors
In addition to the environmental factors, SME are subject to the organization and managerial practices of their companies. The strategy adopted by the company (differentiation, cost control, internationalization) generally forces it to implement more or less sophisticated tools (Bergeron 2000;Lorino 2003). This management instrumentation is also dependent on certain practices such as the promotion of research and development activities (Simons 1995)
8. Methodology a) Source of data and characteristics of the sample
The data used in this study resulted from a survey as part of the international project on the analysis of the determinants of business performance in Frenchspeaking sub-Saharan Africa, funded by IDRC (International Development Research Center). As part of its "Growth for All" Program. This data was collected from 642 companies in the three main cities of Cameroon (Yaoundé, Douala and Bafoussam), based on the data from the World Bank's Regional Program on Enterprise Development Cameroon-2009 (RPED). We finally selected 314 SMEs with 6 and 100 employees, thus constituting our sample. The characteristics are presented in Table 1 below.
9. b) Operationalization of variables
We have identified in the write up that the table that summarizes these factors is the following table.
10. Source: The authors c) Econometric model of dashboard
The general form of the econometric model is as follows:
Tablobord = ?0 + ?1FCS + ?2FCC + ?With Tablobord, the dependent variable indicating the adoption or not of dashboards in Cameroonian SME.
FCS and FCC are respectively the vectors of independent variables in relation to the structural and behavioural contingency factors, likely to determine the adoption or not of dashboards by SME. ?0 = the constant; and the others ? ranging from 1 to 2 = regression coefficients and i = individuals or SME At the end of the Factorial Analysis of Multiple Correspondences (AFCM) which followed the review of the literature of this research, and given the general model above, we can have the following specific model: Tablobord = ?0 + ?1Age10etplu + ?2Measurement + ?3Formality + ?4Presccret + ?5Delpridec + ?6Gratspe + ?7logicsuiproc + ?8ExpManager + ?9BacEtPlus + ?10 FormetierEse + ?i With ?0 being the constant, the others ? ranging from 1 to 10, the regression coefficients. As determinants of the use of the dashboards in the SMEs selected at the end of the phase of multidimensional exploratory analysis (MCA), we have: the age of the company above 10 years (Age10etplu); the size of the company (Moytaille); the formal or informal character of the SME (Formalite), the pressure of foreign competition or the external environment (Presccrétr); delegation of decision-making (Delpridec), the use of special bonuses in case of positive employee results (Gratspe); process
11. d) Choice of tools and methods of data analysis
Data collected from a secondary source was coded and processed using Spad5.5 and Stata 13 software. These data were processed in two phases. The first phase is subdivided into two stages. In the first step, we started from the existing work on contingency factors to select those factors that served as a basis for exploration in Cameroonian SMEs. In the second step, we have developed an ACM of the factors found in the previous exploratory phase to draw the most important factors likely to have an influence on the adoption of the dashboard in Cameroonian SMEs. In the second phase, a logistic regression made it possible to establish the link between these contingency factors and the use of the dashboard.
IV.
12. Results and Discussion
The discussion of the results of this study is based on both exploratory analysis and binary logistic regression.
13. B
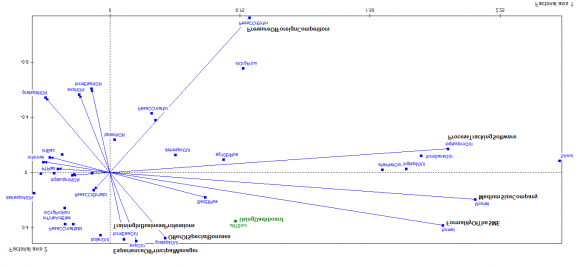
By observing the figure above indicating the relationships between the determining variables in the use of the dashboards and the non-use of the said dashboards, it is easy to notice that the characteristics that best define the use of the dashboards modalities are:
formality, delegation of decision-making (decentralization), age of SME greater than or equal to 10 years, average company, special bonuses offered to employees in case of positive results, the experience of the principal manager, the level of education higher or equal to GCE Advanced level, the basic training of the main manager of the company (in relation to the business or non-business professions), software for monitoring procedures, pressure from the external competition. These modalities are selected on the basis of the principle according to which each modality or each variable is positioned in the graph at the centre of gravity of the individuals who possess it, or modalities and variables which are close to it.
14. b) Interpretation and discussion of the results of the correlation matrix
The following table summarizes the results from the correlation matrix.
15. Table 3: Summary of the correlation matrix between variables at the 1% threshold
16. Source: Data Analysis in Stata 13
*Significant influence at 1%.
Since the logistic regression can interpret only the signs of the coefficients, it is very often recommended to calculate the marginal effects in order to deepen the interpretation in terms of the level of influence of one variable on another. The marginal effects in a censored regression model correspond to the deformation of the predictions on the dependent variable caused by a variation of one unit of one of the explanatory variables (Cameron and Trivedi 2005). Thus, the following table presents the marginal effects of logistic regression.
17. Source: Data Analysis in Stata 13
Referring to the data in Table 4 and Table 5, it appears that the adoption or use of DBs by Cameroonian SMEs is significantly and positively influenced by four groups of variables.
First, the use of DBs is dependent on the characteristics of the SME (its formal character and its age greater than 10 years). In fact, Hernandez (1997) and Kamdem (2000) consider that the management style of African companies depends on the specificities of their context. For them, the strong presence of the informal sector in African economies would justify the weak management instrument. In addition, the older the SME is, the more it is structured, which requires more tools in the same direction of management; however, this idea is not shared by Holmes and Nicholls (1988), for whom the detailed acquisition of management information decreases as the age of the enterprises increases, and more precisely that SMEs with less than five years of business operations have more often more detailed information than SMEs with more than 10 years of market activity.
Secondly, foreign competitive pressure also has a positive influence on the use of the dashboards. In a context of higher globalization and intense level of competitiveness, the use of management tools in SMEs determines, initially, the operational performance, and then the financial performance (Pettersen et al., 2011).
Thirdly, the organizational and managerial factors influence the use of DBs in SMEs. In fact, some business managers still showreluctance in letting someone else manage their organizations (usually family businesses), and at some point in the life of a business, this decentralization is necessary in order to change the company, especially when the company is expanding. In the current digital environment, SMEs should also consider the use of ERP (Enterprise Resources Planning) or specific software to improve the day-to-day management.
Fourth, the individual factors related to the key leader of the SME (his professional background and expertise). In fact, the use of dashboards in companies depends partly on the experience that the manager has acquired from his previous profession or simply during the exercise of his profession. These results are in line with those of many other authors (Marchesnay 1985;Nelson 1987;Bergeron 2000), while some authors find different results including Reix (1981). The variable regarding the manager training in relation to enterprise related fields as we noticed above proved to be negative and not significant. This means that the training of the manager in relation to enterprise related fields is not related to the use of dashboards in SMEs in Cameroon. This result is conflicting with the one obtained by Djongoue (2007). The baccalaureate level and above, was found to have no influence on the use of dashboards in Cameroonian SMEs. Indeed, there is a negative and significant relationship between the level of higher education or equal to the baccalaureate and the use of dashboards. Such a result may be justified by the fact that the vast majority of SME managers in Cameroon generally have a lower level of education or equivalent to GCE Advanced level.
V.
18. Conclusions
The objective of this research was to highlight the contingency factors likely to foster the use of dashboards in Cameroonian SMEs. Our results suggest two major directions.
First, the proportion of Cameroonian SMEs using DBs remains very low (27% of SMEs in the sample). According to some authors (Hudson et Secondly, the factors that influence the adoption of the dashboards are those related to the characteristics of the SME (formal character, size and age), the environmental context linked to foreign competition, and organizational and managerial factors (delegation responsibility, special reward systems, use of software) and individual factors related to the SME manager (professional experience). The research insights resulted from this study incorporate both theoretical and practical contributions.
On one hand, our research provides theoretical support to the question of management instrumentation in SMEs. The results already noted in the existing body of literature are enriched by others making it easy to give a content to this question in a context marked by the exponential growth of SMEs. It is a confirmation of the complex nature of this concept. Furthermore, this research has found that the adoption of a management tool is strongly correlated to the cognitive resources and managerial skills of the main manager of the SME.
On the other hand, at a managerial level, beyond the growing criticism of management tools, particularly the increased rationalization and standardization of tools (Berry, 1983), or consistency with the organization (Moisdon, 1997), the use of DBs is advantageous because it is a tool that changes the perception of the performance of the SME, considering both internal and external stakeholders. Then we also noticed that SMEs often caricatured in write ups as a category of companies with a simple structure and intuitive management are capable of controlling their structure with DBs. Finally, it also provides policy makers with a new research direction on the parameters that require the management attention in order to improve the assessment of the performance of SMEs seeking external funding. It gives the leaders of SMEs, of course, some elements that can help them in the process of implementation of DB in their management.
These results also challenge us about the need to question the priorities in the management instrumentation of SMEs. The lower rate of usage of DBs by Cameroonian SMEs (27%) suggest the hypothesis according to which these tools are not well known among SMEs or that they do not match their business needs. 10. Chapman, CS (1997)

| III. |
| Determinants of the Adoption of Dashboards in SMEs | |||||||
| Year 2021 | |||||||
| Volume XXI Issue IV Version I | |||||||
| ( ) B | |||||||
| Criteria Limited liability companies Legal Status Unique owner Unlimited liability companies Turnover in (FrsCFA) 1 [15 -50 million] [51 -100 million] [101 -500 million] | % 38,1% 50% 11,9% 40,48% 23,81% 28,57% | Criteria Basic training of the leader Leader Status Owner Non owner Basic training in relation with enterprise related fields. No basic training in enterprise related fields. | % 71,65% 28,35% 55,73% | Global Journal of Management and Business Research | |||
| [501millions -1bilion] | 7,14% | 44,27% | |||||
| Age of SME | Leader's experience | ||||||
| [1 -5 years] | 33,33% | Experience | acquired | from | another | 53,18% | |
| [6 -10 years] | 19,05% | enterprise | |||||
| The variables | Description of the variable | Authors | |||
| 1 | 2 | 3 | 4 | 5 | |
| Kaplan and Norton | |||||
| Dependent | variable | Adoption of the Dashboard in SME (DB) | Dichotomous variable that takes the value of 1 if the SME uses dashboard (DB) and 0 value if not | 1992, 1996; Simons 1995; Elhamma 2012; Said et al. 2003; Takoudjou and Teulon | |
| 2018; Nimpa & al 2019. | |||||
| Dichotomous variable that | |||||
| Age of SME 10 years and above | takes the value of 1 if the SME | Mintzberg, 1982; | |||
| (AgGreater than10) | is 10 years or more than 10 | Chapellier, 1994 | |||
| Independent variables | Characteristics of the SME Environmental and contextual factors | Medium Seize Enterprise (Meseize) Formal SME (Formalite) Ownership structure (STRUCAPI_SA) Competition/Competition of the foreign companies / Environment (presccrétra) Competition/Competition of the of national enterprises/ Environment (presccrnat) | years and 0 if not. Dichotomous variable that takes the value 1 if the enterprise is a medium seize enterprise and if 0 if not. Dichotomous variable that takes the value 1 if the SME is formal and 0 if not. Dichotomous variable that takes the value 1 if the SME is an unlimited liability company and 0 if. competition and 0 if not. Dichotomous variable that takes the value 1 if the SME is undergoing a strong foreign competition and 0 if not Dichotomous variable that takes the value 1 if the SME is undergoing a strong national | Nobre 2001a, 2001b; Lavigne 2002; Van Caillie 2002; Hoque and James 2000; Elhamma 2013; Ngongang 2013. Hernandez, 1997; Kamdem, 2000. Ngongang 2006; Ngongang and NoumouenNjoyo 2018. Dimaggio and Powel 1983 Pettersen at al. 2011 | |
| factors Organizational | The vision/goals targeted by the main manager (infvisObjEls) Encouraged research activities for the past 2 years (redev2ane) | Dichotomous variable that takes the value 1 if the main manager has a training in an enterprise related fields and 0 if not. Dichotomous variable that takes the value 1 if the SME has for the pass and 2 years 0 if carried out research activities | Chapellier 1994, 1997; Pettersen at al. 2011; Ndjambou and Sassine 2014 Simons 1995; Katia 2016 |
| Determinants of the Adoption of Dashboards in SMEs | |||||||||||||
| Pres ccrétr | Gratspe | Logics uiproc | Ag10et Plus | Moytai lle | Forma lite | BacEt Plus | Del pridec | Forme tierElse | Exp Manag er | Tablo bord | Variables | Year 2021 | |
| 0.1236 0.0285 -.0426 0.4520 -.0601 0.2886 0.1663* 0.0031 0.0145 0.7985 0.1331 0.0183 0.1285 0.0228 | 0.2575* 0.0000 0.1619* 0.0040 0.2233* 0.0001 0.1039 0.0660 0.2002* 0.0004 0.2951* 0.0000 0.2349* 0.0000 | 0.2277* 0.0000 0.0752 0.1840 0.0370 0.5132 0.1373 0.0149 0.1328 0.0185 0.4844* 0.0000 0.4580* 0.0000 | 0.2450* 0.0000 0.0375 0.5079 -.1074 0.0572 0.2512* 0.0000 0.2053* 0.0002 0.3496* 0.0000 0.3161* 0.0000 | 0.2667 * 0.0000 0.1017 0.0718 0.1023 0.0701 0.2349 * 0.0000 0.3169 * 0.0000 0.7414 * 0.0000 1.0000 | 0.3796 * 0.0000 0.1776 * 0.0016 0.1211 0.0320 0.2435 * 0.0000 0.4218 * 0.0000 1.0000 | 0.1594* 0.0046 -.0046 0.9348 -0.0057 0.9192 0.1871* 0.0009 1.0000 | 0.3005* 0.0000 0.0723 0.2014 -0.0210 0.7114 1.0000 | 0.0154 0.7860 0.2817* 0.0000 1.0000 | 0.2614* 0.0000 1.0000 | 1.0000 | Tablobord ExpManager FormetierElse Delpridec BacEtPlus Formalite Moytaille | Volume XXI Issue IV Version I ( ) B | |
| Iteration 0: logpseudolikelihood = -184.34473 Iteration 1: logpseudolikelihood = -144.957 Iteration 2: logpseudolikelihood = -142.96356 Iteration 3: logpseudolikelihood = -142.95689 Iteration 4: logpseudolikelihood = -142.95689 Log pseudolikelihood = Logisticregression Number of observations = 314 Wald chi2(8) = 61.35 Prob>chi2 = 0.0000 Pseudo R2 = 0.2245 0.1035 0.0670 0.1013 0.0732 0.1352 0.0165 1.0000 0.1708* 0.0024 0.1373 0.0149 1.0000 -0.0026 0.9640 1.0000 1.0000 | Ag10etPlus Logicsuiproc Gratspe Presccrétr | Global Journal of Management and Business Research | |||||||||||
| Tablobord | Robust Coefficient | Std. Err. | Z | P>|z| | 95% Confidence Interval | ||||||||
| ExpManager | 1.063099 | 0.3110853 | 3.42 | 0.001 | 0.4533832 | 1.672815 | |||||||
| Delpridec | 1.10571 | 0.3275424 | 3.38 | 0.001 | 0.4637385 | 1.747681 | |||||||
| Marginal effects after logit | y = Pr (Tablobord) (predict) = 0.22091718 | ||||||
| variable | dy/dx | Std. Err. | z | P>|z| | 95% Confidence Interval | X | |
| ExpManager* | 0.1793271 | 0.04988 | 3.60 | 0.000 | 0.081567 | 0.277087 | 0.531847 |
| Delpridec* | 0.1860001 | 0.05164 | 3.60 | 0.000 | 0.08478 | 0.28722 | 0.535032 |
| BacEtPlus | -0.0167554 | 0.05625 | -0.30 | 0.766 | -0.127011 | 0.0935 | 0.38535 |
| Formalite * | 0.2001043 | 0.10602 | 1.89 | 0.059 | -0.0077 | 0.407909 | 0.165605 |
| Ag10etPlus* | 0.1021438 | 0.06457 | 1.58 | 0.114 | -0.02441 | 0.228698 | 0.324841 |
| logicsuiproc* | 0.0979191 | 0.09748 | 1.00 | 0.315 | -0.093132 | 0.288971 | 0.098726 |
| Gratspe * | 0.1317673 | 0.05391 | 2.44 | 0.015 | 0.026102 | 0.237432 | 0.535032 |
| Presccrétr* | 0.086267 | 0.09525 | 0.91 | 0.365 | -0.100416 | 0.27295 | 0.101911 |
| (*) dy/dx is for discrete change of dummy variable from 0 to 1 | |||||||
| Congrès | international | francophone | sur | |||
| l'entrepreneuriat et les PME, 57-77. | ||||||
| 22. Elhamma A (2012) Contrôle de gestion et | ||||||
| performance: | cas | des | PME | marocaines, | ||
| Communication | au | colloque | internationale, | |||
| Management des PME et compétitivité territoriale, | ||||||
| ENCG Fès, Mars. | ||||||
| 23. Elhamma A (2013) Performance de la Comptabilité | ||||||