1. Introduction
urnover tax is available to individuals who elective qualifying small businesses can choose to register for the standard tax system or for turnover tax. Turnover Tax will be calculated by simply applying a tax rate to a "taxable turnover". Turnover taxes have parameters in place to determine when such taxes should be assessed, and at what rate (Mc Cluskey, 2011). Turnover tax is favorable for the business concerned implemented to simplify very complex tax rules and regulations. Turnover tax is perceived simpler to comply with does not necessarily mean that the associated tax payable is fair and tax system may potentially be burdening the taxpayer even more than the complex income tax system (Hassan, 2011).
Ethiopian government Proclamation No. 308/2002, TOT is applicable to any resident person whose turnover from business does not exceeds 500,000 during any year of income. Turnover tax is imposed on the supply of taxable goods and services by persons not registered for VAT. It is chargeable at 2 per cent on locally sold goods and 10 per cent on all other services (FDRE, 2002).
Therefore, turnover tax collection performance can be affected by different factors. In turnover tax revenue practice there are internal and external factors which affect the tax revenue amount selected woredas. The researcher declares that; identify factors affecting Turnover tax collection performance from those; this paper focused on enforcement of law and regulation, effectiveness of TOT administration practice and taxpayers attitude toward payment of tax in selected woredas.
2. a) Statement Problem
Revenue collection is enables the government to acquire assets which are not liable to debt and which the government uses to develop its economy. Tax administration therefore, should aim at improving on laws regarding the registration, assessment, collection revenue, and exploiting fully taxation potential of a country (World Bank, 2015). Previous studies (Ngungi, 2011; Meena, 2013; Ndungu, 2013) posits identified factors affecting revenue collection that include services delivery, staff motivation, legislation, public participation, employee competency and integrating information and technology and payment was identified to the main challenges that inhibits revenue collection. Simiyu (2013) further argues that challenges affects turnover tax collection that include taxpayers' ignorance of their obligations, prohibitive rate of turnover tax, rate of payment affects tax collection.
In Ethiopia has faced budget deficit every year since introduction of TOT is an affirmative action which was aimed at incorporating the SME sector into national taxation system. However, the performance of TOT has not been satisfactory and TOT revenue has been below average in 2017/2018 years since its inception. According to ERCA (total revenue collected from the TOT less than against target collection each year). On TOT recruitment, the performance has on average been below 70% (ERCA, 2018).
Others studies (Tigistu, 2014;Tadele, 2015) forwarded that Imposition of tax couldn't still bring the required result due to a number of reasons such as lack of clear understanding about the tax system by the tax payers, tax payers don't comply with their tax obligation, hostility between the tax payers and tax officials, economical factors, negative attitude of tax payer towards the tax system, that is, understating their taxable income by significant amount and related. For these reasons, the actual amount of tax couldn't be collected properly. However, these studies were the gap into measure revenue performance and identify the problem that this study sought to address. Despite of selected wore das revenue authority has been facing various factors affect which make it not to attain at most (100%) the projected targets. In 2017/18 the targeted revenue was million 9041224 with the actual revenue being million 7888536 (87.25%) the existence of turnover tax collection gap.
This study was, therefore; undertaken to bridge the research gap through discovering factors which affect TOT performance by taking the case of some selected wore das of West Shoa Zone of Oromia Region through answering the following research questions.
3. b) Hypothesis H0 1 :
There is no significant relationship between employee qualification and manpower with performance of TOT collection. H0 2 : There is no significant relationship between management commitment and performance of TOT collection. H0 3 : There is no significant relationship between taxpayer's registrations and performance of TOT collection. H0 4 : There is no significant relationship between technological and information system and performance of TOT collection. H0 5 : There is no significant relationship between compliance cost and performance of TOT collection. H0 6 : There is no significant relationship between tax knowledge and performance of TOT collection. H0 7 : There is no significant relationship between tax fairness and performance of TOT collection. (Harrison, 2007). Bird (2015) argues faults revenue collection are inadequate tax assortments and academic faces a problem of incompetent tax supervision. The preceding problem is attributed to with inadequate administrative work with necessary skills, and high level of illiteracy among taxpayers and tax collectors.
4. b. Management Commitment level
Managers Operations are also agents of the people and stewards of the democratic process and are morally obligated embody achieve goals, objectives and its mission of public interest and the constitutional governance process during strategic planning. Decision-flow processes are vehicles to integrate results into coherent patterns for developing, implementing, and controlling decision making (Wresch & Fraser, 2011). Also management culture is a set of socially acquired values that managers accepts as a whole and transmits to its members through language, symbols and more proactive and tax compliant.
5. c. Taxpayers registration
Taxpayer enumeration and registration: A good Tax Administration system should identify all those required to pay taxes, registration, recording of taxpayer information and issue unique identification numbers that are fed into a master file upon which updates are made and from which retrievals can be made (Moyi & Ronge, 2006). According to Baingana (2011)that taxpayer identification are most important aspects of tax administration which more taxpayers are located and registered otherwise evade are reduced. Then (Bird, 2015) taxpayers are identified and registered results to enhance efficiency and significantly ease revenue collection.
6. d. Technology and Information system
A cash register is an electronic tool used to calculate and records sales transaction with a cash drawer that will be used to store cash. The computerized processes are minimizing errors, standardization operational procedures and reducing costs. Furthermore, computerized tax system reduces operational costs of expenditure revenue collections to enhance the citizens' welfare prioritizing the society needs (Fisman & Gaht, 2013).
7. e. Compliance costs
Compliance costs are costs associated with obeying the law including planning and administration, direct time and money spent filing paperwork. The tax laws and regulations are legal documents with legal language which is complicated for ordinary taxpayers to comprehend and given the numerous legal amendments every year, taxpayers lack necessary expertise to complete the tax returns. Tax laws should be simplified save time and money SMSs business to lower both compliance costs and administrative costs, to reduce uncertainty faced by taxpayers' and to improve the levels of tax compliance (Kasipillai, 2005).
8. i. Taxpayers attitudes toward payment of tax Tax knowledge
According to Palil (2011) tax education is knowledge about tax laws to determining taxpayers' compliance behavior. Tax educations promote taxpayers understanding of the tax systems, processes, law and associated penalty for defaulting. This tends to increase peoples propensity to comply with tax obligation. Asrinanda (2018) provides tax knowledge affect tax attitudes towards the tax system fair. Knowledge of taxation owned by the taxpayer will affect the obedience of the taxpayer itself in carrying out its tax obligation and affect tax revenue received by the state if the people already have low tax knowledge.
f. Tax Fairness According to Lemessa (2007) state that all taxpayers dealt a given taxpayer would accord the same treatment. Kayaga, (2010), stated three types of fairness's, namely: horizontal, vertical. Horizontal equity expresses the principle that similarly situated taxpayers should pay the same amounts of taxes because they have the same ability to pay. Vertical equity is principles that are "better off" bear a larger proportion of the tax burden while those who are "worse off" should bear less.
9. g. Performance of Tax Collection
As to Simon James & Clinton Alley (2004), the USA IRS has two definitions for tax gap -gross tax gap and the net tax gap. The gross tax gap is the amount of 'true' tax liability that is paid 'voluntarily' and on time and the net tax gap is amount less tax paid late or collected by the IRS through enforcement activities. Baingana (2011) asserts that without adequate tax revenues, governments cannot provide the necessary public services to foster growth. Tax revenue pushes governments to levy ever more distortionary taxes in attempts to raise funds. Thus, improvement in administration would lead to increased revenue performance.
h Empirical evidence Simiyu (2013) was Studied on "Challenges Affecting Collection of Turnover Tax". This study identified factors were; Taxpayer's ignorance of their obligations, mode of payment and the frequency of filing returns, Corruption and collusion between taxpayers, Government Policy formulation and quality of services to taxpayers.
Meena (2013) carried out the study on "Assessment of the challenges facing revenue collection in Tanzania". This study identified were; Weak administrative capacity to assess taxes and levies and enforce revenue laws and by laws, Taxpayer resistance and low morale on the part of citizenry, Corruption including embezzlement of revenue, Political pressure on the revenue collectors to relax in revenue collection, broadening the tax base, informal sector included in the tax net, Improving staff integrity, ensuring that all due government revenue is collected, tax evasion and avoidance are controlled.
Dave (2014) carried study on "factors influencing turnover tax compliance in the Kenya revenue authority". This study identified crucial factors that were; taxpayer's perception of the tax system, taxpayer's level of awareness, enforcement efforts by the revenue authority, costs of compliance.
Tadele (2015) study on "Analysis of Tax Buoyancy and Its Determinants in Ethiopia." forwarded that Imposition of tax couldn't still bring the required result due to a number of reasons such as lack of clear understanding about the tax system by the tax payers, tax payers don't comply with their tax obligation, hostility between the tax payers and tax officials, economical factors, negative attitude of tax payer towards the tax system, that is, understating their taxable income by significant amount and related. Generally empirical studies undertaken far for developing countries, particularly for Ethiopia, bothered little or no to see the potential challenges faced by taxpayers and the tax authorities in administering different tax activities such as turnover tax collection performance.
10. i. Research Gap
The researcher believes that some gaps in the area of tax collection not tested and addresses the issue in depth archive full potentiality on turnover tax collection performance. This are little study has been carried out on the factors turnover tax rate, tax evasion, compliance cost, employment qualification and manpower, management commitment level, tax knowledge, tax fairness, tax audit, low usage of Electronic tax register, tax avoidance and tax registration. Therefore a research gap exists that need to be filled by doing a through survey on the factors affecting turnover tax collection performance revenue authority.
11. Global Journal of Management and Business Research
12. Methodology a) Description of Study
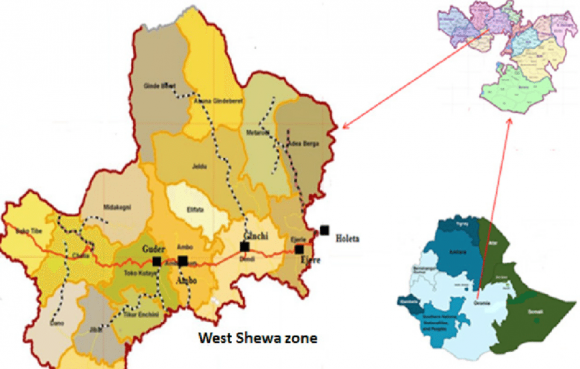
This research has been factors affecting turnover tax collection performance on conduct in Zonal town is Ambo which it located 112 Kms West of the capital Addis Ababa, on the road to Nekemte (Fanos Mekonnen, 2012). This research were study on West Shoa Zone such as:-Caliya, Ejere, and Nono select woreda of revenue authority. Research design is the arrangement of conditions for collection and analysis of data in a manner that aims to combine relevance to the research purpose with economy in procedure. Cross sectional design is based on observations made at one point in time. Data collection strategy is broader in scope and involves systematic data collection we use and difficult to make inferences about processes that occur over time and hence cause and effect (Kothari, 2008).
13. c) Research Approach
gather detailed information allow exploring and better understanding the complexity of a phenomenon (Creswell, 2010). Quantitative research approach has generates precise, statistically reliable, extensiveness of attitudes held by people, numerical data from survey sizes and provides objective measure of reality (Creswell, 2010).
14. d) Target population
According to Mugenda and Mugenda, (2011), explain that the target population should have some observable characteristics, to which the researcher intends to generalize the results of the study.
15. e) Sampling Methods
A sample Designis a definite plan for obtaining a sample from a given population. It refers to the procedure the researcher would adopt in selecting items for the sample and determined before data are collected for his research study (Kothari, 2008). Systematic sampling is first item would be selected randomly and the remaining units of the sample are selected at fixed intervals. Purposive sampling was used to judgmental, selective or subjective sampling of the study (Creswell, 2010).
16. f) Sample Size Determination
Taro Yamane (1967) assumes homogeneity of the taxpayers and the existing resources to determine the sample size by the precision level. Sample size for taxpayers; g) Data Collection Methods Structured questionnaire & personal interview was contact face-to-face primary data collection allowed the participants respond statement collect information on their attitudes, feelings under study (Kohtari, 2008). Secondary data was obtained from annually turnover tax performance reports of six year (2013-2018) revenue authority.
17. h) Method of Data Analysis
Qualitative data was used in-depth, descriptive character, often not attainable using quantitative measures (Creswell, 2010). Quantitative data analysis (Field, frequently zero or very close to zero and that differences Qualitative research approach was used to provide descriptive forms using in-depth interview questionnaires which would enable the researcher to much greater than zero happen only occasionally. In fact, predictors do not need to be normally distributed (Field, 2009). According to Field (2009) suggests that a small degree of association between explanatory variables will almost always occur but will not cause too much loss of precision. However, a problem occurs when the explanatory variables are very highly correlated with each other, and this problem (Brooks, 2008).
18. i) Factor Analysis
Factor analysis is test the multi-dimensional scale in which all variables, extraction variances a Factor loading is how much the variable contributes to the factor and high factor loading scores indicates better accounted by the variables (Field, 2009).
19. j) Correlation
A value of +1 represents a perfect positive correlation means two variables are precisely related and values of one variable increase as turn as other variable will increase. By contrast, a value of +1 represents a perfect negative correlation means two variables are precisely related; as the values of one variable increase those of the other decrease. Within business research it is extremely unusual to obtain perfect correlations (Marketal., 2007).
20. k) Model Specification
Structure questionnaire process was analyses by SPSS version 22 to regress multi-linear model. Multiple regressions are analysis of two or more than two independent variables (kohtari, 2008). Following multiple regression equation as:
TOT performance = ? 0 + ? 1 EQMP + ? 2 MCOMT21. Result and Discussion
22. a) Responses Rate
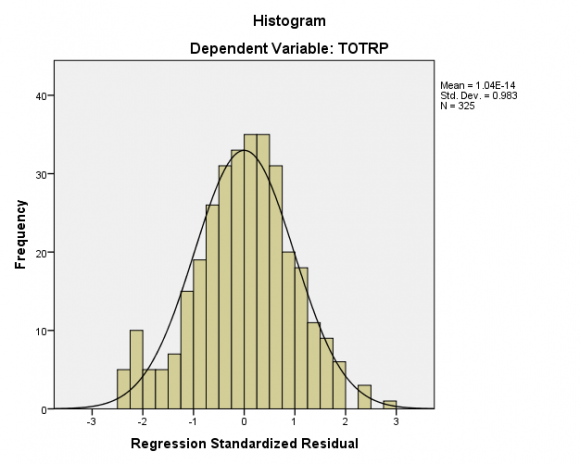
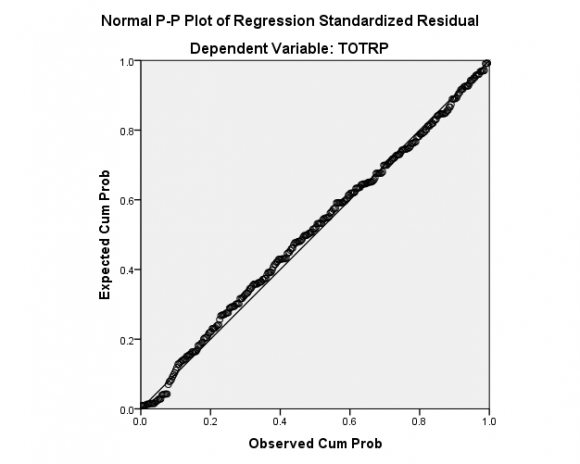
Out of the 361 questionnaires issued, 325 (90%) questionnaires were returned, while 36 (10%) questionnaire was not returned from respondents. High rate of participation conducted for fit analysis whose participated rate was 70% and above is very excellent for analysis and start to preparation of reports support by (Mugenda and Mugenda, 2011) (kothari, 2008). Factor loadings are significance items are retained only when the absolute size of their factor loading is above 0.50 as satisfactory in social sciences research (Field, 2009). ii. Test for Normality The skewness and kurtosis data are normally distributed the range of values need to be from -3 to +3. Because without probability sampling, error estimates cannot be constructed (Field, 2009). Conclude that normal distribution residuals around mean were zero and inferences of the researcher made population parameter valid. Current model VIF values are below 10 and tolerance statistics above 0.2 so there is no variable suffered from excessive and any treatment for multi-Colinearity of the data. strength relationship between both variables contain quantifiable dependent variable and one or more quantifiable independent variables (Mark et al., 2007). Hypotheses were tested at significance level 0.05 and conventionally used. Probability values of the boundary between rejecting and not rejecting null hypothesis (Ogula, 2014). The F critical at 5% level of significance was 0.000 and F calculated (30.573) is greater than the F critical so this shows overall model was significant.
23. iv. Multiple Regression Coefficients
24. v. The Regression Model Equation e) Discussion of the Findings and Hypothesis test i. Effectiveness of Turnover tax administration H0 1 :
There is no significant relationship between Employee qualification and manpower with performance of TOT collection.
Employees qualification and manpower are positively related with performance of TOT collection and most statistically significant (p-value = 0.000) and tratio of 3.873 greater than 2 was significant. This implies that administration brings one unit changes in employee's qualification and manpower than it is now, this will results 0.133 units or 13.3% changes the performance of TOT collection. We reject the null hypothesis stated that there is no significant relationship between employee qualification and manpower with performance of TOT collection. The authority still needs to add its man power by recruiting knowledgeable manpower and develop skills of the existing employees through trainings about understanding of tax structure and understand tax laws. As an interview, "We have a shortage of well trained and qualified personnel supposed to serve for returns analysis taxes and rates at the local level, even the few are not properly trained in budgetary and financial management systems. Revenue office was results responsible for not to attain target revenue collection from turnover tax sources????" (Participants 10 male, 2 female)
This finding agrees finding of Kayaga (2010) that financial constraints has led to hiring of tax officials who lack understanding of the tax laws they are TOT performance = 86.462 + 0.133EQMP +0.146MCOMT + 0.146TREG + 0.142ITS -0.043TCC + 0.102TKNOW-0.10TFAIR + ?
25. Global Journal of Management and Business Research
Volume XXI Issue II Version I Year 2021 ( )
C © 2021 Global Journalsadministering, inexperienced the concepts of accounting requisite to analyzing returns. H0 2 : There is no significant relationship between management commitment and performance of TOT collection.
Management commitment level are positively related with performance of TOT collection and most statistically significant (p-value = 0.000) and t-ratio of 4.597greater than 2was significant. This implies that administration capability brings one unit changes in management commitment level than it is now, this will results0.146 or 14.6% changes performance of TOT collection. We reject the null hypothesis stated that there is no significant relationship between management commitment and performance of TOT collection. Tax offices were serious managerial problem which slow strategic leadership for implementing TOT policies, not well-motivated plans to compete effectively gaining turnover tax performance.
26. As the interview;
"I think probably most management employees would not try detail implement turnover tax policies and strategies. There is legal enforcement and give advice direction of dishonest of experts enter into work to improved turnover tax collections performance??."(Participant 10male, 2 female)
The findings agree with finding of Ayugi (2015) where he found out that revenue collection functions are greatly influenced by factors such as, board characteristics' leadership styles, top management commitment and organizational structure. H0 3 : There is no significant relationship between taxpayer's registration and performance of TOT collection.
Taxpayer's registrations are positively related with performance of TOT collection and most statistically significant (p-value = 0.000) and t-ratio of 3.968 greater than 2 was significant. Administration capabilities bring one unit changes in taxpayer's registrations than it is now, this will result in 0.161 units or 16.1% changes the performance of TOT collection. We reject the null hypothesis there is no significant relationship between taxpayer's registrations and performance TOT collection.
Taxpayer's registration was inadequate effective revise their number every year from taxpayer's record with submits their book, need of knowledge (awareness) about the time, ways of registering, exaggerated rules imposed and inconsistent TOT registration system followed by the authority.
27. As the interview;
"I think that there is shortage of manpower and incompetence associated with inconveniency of SIGTAS that using to decide, they need society buy goods and services without TOT and unconsciousness of the taxpayers about the responsibilities that they do have in relation to tax registration?????"(Participants 10 male, 2 female)
This finding support finding of Moyi & Muriithi, (2003) that increases burden of taxpayers was discourage. Similarly agree finding Katusiime (2007) as cited in Baingana (2011) argued that inadequate tax payers' registrations is the most important factor to affects the collection procedure and revenue collection performance. H0 4 : There is no significant relationship between Technological and information system and performance of TOT collection. Technology and information system are positively related with performance of TOT collection and most statistically significant (p-value = 0.000) and tratio of 3.981 greater than 2 was significant. We reject the null hypothesis that there is no significant relationship between technological and information system and performance of TOT collection. There is no effective control manipulation of the cash register machines when purchasing and sales good and services. Thus provide a mistaken check of gross sales. The TOT registrant was sale goods and services without tax invoices.
28. As the interview;
"Tax administration activities are supported by ICT partially. Tax authorities was not used computer programs which to maintain taxpayer register and process of TOT returns. This results increasing opportunity for people to evade tax?."(Participants 10 male, 2 female) These findings validated finding by Mugo (2016) found that ICT infrastructure determines how revenue collection systems are implemented and used by customers as wheel this affects revenue collection. i. Attitude towards payment of tax on turnover tax performance H0 8 : There is no significant relationship between tax knowledge and performance of TOT collection.
Tax knowledge are positively related to performance of TOT collection and most statistically significant (p-value = 0.000) and t-ratio of 2.773 greater than 2 it is significant. Tax knowledge by one unit change than it is now; this will change the performance of TOT collection by 0.102 units or 10.2%. We reject the null hypothesis that there is no significant relationship between tax knowledge and performance of TOT collection. Taxpayers didn't have adequate training of tax knowledge in their environment for payment of tax to undermine volume of sales. Tax as a harm not absolute As an interview from revenue officers indicate that; "I'm not really aware of the tax laws and regulation in details such as obligation and good culture payment of tax. Taxpayers who did not announce their real taxable income for tax collectors and unknowing tax knowledge is very severe on payment of tax. This result revenue office was not pertaining adequate education and awareness training on tax issue for taxpayers?????" (Participant 10male, 2 female) This finding agrees finding of Asrinanda (2018) states that tax knowledge for taxpayers greatly affects taxpayer's attitude of tax system fair and affect tax revenue received by the condition if the people already have low tax knowledge. H0 9 : There is no significant relationship between tax fairness and performance of TOT collection.
Tax fairness are negatively related with performance of TOT collection and most statistically significant (p-value = 0. .006) and t-ratio of 3.988 greater than 2 was significant. Tax fairness by one unit change than it is now, this will changes the performance of TOT collection by 0.100units or 10%. We reject the null hypothesis that there is no significant relationship between tax fairness and performance of TOT collection. Taxpayers think that tax system is unfair if their perception towards less than pay.
29. As an interview;
"I think tax system is really unfair and don't pay a lot of business based on your ability to pay. I think the main reason tax assessor committee was not accurately unbiased to determine tax liability so it is heavily relies the categorization of taxpayers' grades on the judgment. The results exists tax fairness problem in the tax system and make decision to under report your income??.."(Participant 10 male, 2 female) V.
30. Chapterfive a) Summary of Findings Conclusion and Recommendation
31. i. Summary of Findings
The main objective of this study was determining factors affecting turnover tax collection performance. Specific objectives were to identify factors that the effectiveness TOT administration, how taxpayers attitudes toward payment tax. Data was analyzed using factor analysis and multiple linear regressions method. The major findings of the study are the following: ? Employee qualification and manpower in tax office was not continuous training and clarification about tax collection as well as less competent of duties and responsibilities. A lot of works has to be done by one employee that overloads the employee and they do not finish their work on time. Inadequate employee qualification and man power did not cover all taxpayers in their area. ? Management commitment by tax officer was slow in strategic leadership for implementing TOT collection policies. No managerial control for successive adequate plans and feasibility to compete effectively turnover tax performance. ? Taxpayer's registrations ineffective in that taxpayer's not record and undervalue their turnover, exaggerated TOT rules imposed on the taxpayers, the inconsistent TOT registration system followed by the authority. This was also found taxpayers register with involvement of tax official which results unfair competition and registered tax payers will lose their potential customers to illegal trader. Inconveniency the system and inefficiency of the employees and lack of consciousness of the taxpayers about the responsibility that the authority is using to decide from tax officers. ? Compliance cost on turnover tax collection revealed a strong negative relationship but compliance cost has insignificant effect on the performance turnover tax collection. The study felt that consultancy charges, filing tax returns on tax computation, traveling cost and cost of hiring professional staff are fair not high. ? Technology and information system efforts taken by authority did not develop such as comprehensive information system; automate tax affairs means of appropriating awareness by the social media about the tax. They also found from tax office requires TOT registrant taxpayers to sale goods and services without tax invoices, there is no effective control of manipulate cash register machine. ? Taxpayers did not tax knowledge on the consequences of not voluntarily registering for TOT because tax official gives inadequate advice tax laws and developed respective regulations.
Taxpayers have no good culture in their environment for payment of tax. This in turn creates tax payers understate the volume of the sales. In addition to taxpayers little idea to deduct for tax liability determined because the educational level also low. Therefore revenue office is not pertaining adequate education and awareness training on tax issue for majority of taxpayers. ? Tax fairness by authority not fair to pay income tax depend on benefit received from government so it is categorized on judgment which increase financial position of taxpayers and not paying tax based on ability to pay. They also found tax administration system was unfairly and not transparent as a result taxpayers make decision under report income tax.
VI.
32. Conclusion
? Employee qualification and manpower are key factor against which efficient tax administration shorten to qualified employees to understanding entire system of turnover tax. The management commitment is vital in the implementation of the TOT collection program. Taxpayers registrations was identify effectively assessment and collection procedures for registering all potential taxpayers without intervention of tax officials, but there is inadequate registration was a challenges for turnover tax collection. ? Technology and information system was important for local authorities because less usage of computerized information systems especially less usage of electronic tax register machines affect revenue collection positively. Tax knowledge is a cornerstone attitude of taxpayers towards tax payment and impossible to imagine about effective turnover tax collection where there is inadequate knowledge of taxpayers. In tax fairness there was no fair income distribution among taxpayers. This result was reducing tax performance.
VII.
33. Recommendation
That is why study suggests the following:
? Tax officer's using continuous employer's clarification and adequate manpower. ? Managements ensure commitment level to implement effective policy and motivated staff's employees by financial incentives to encouraged TOT collection commitment. The management was work team spirit by solving internal layers of management problem with its attendant bureaucracy. ? Revenue authority ensures tax payer status occur contacts and location. Simplifying the registration of businesses with effective door-to-door inspection. ? ITS facilities on tax administration and effectively control taxpayers manipulate cash register machines and fake invoices to secure more input tax. Using ETRs reduces time with money of tax payers and reduces evasion. ? Revenue Officers have to carry out education center of TOT. Tax Fairness was an equal treatment of taxpayers with in the same income brackets equally, transparency of revenue office,, unbiased tax assessor committee, and trusts in tax systems.
34. a) Recommendations Future study
The research has highlighted turnover tax collections. The study had determined persistent factors that hinder the Revenue Authority failure to raise adequate from TOT for economic and social developments. We recommend that further research is required in Revenue Authority to know factors that affect the quality service, politico legal factors, accountability and transparency and tax non compliance.
| Latitude | Longitude | ||||
| Chaliya | 9 ? 02-9 0 1N | 37 °25-37 °16E | 1700 -3060 | 8-25 ° | 750 -1000 |
| Ejere Chaliya | 8 Nono | Ejere West Shoa | |||
| Oromiya |
| 2: Taxpayers Profile |
| 3: Respondents profile | |||||
| No. | Type | Chaliya | Sampling method Ejere Nono | Total | |
| 1 | Sample size Taxpayers | 123 | 117 | 121 | 361 |
| Revenue officers and department heads= 12,Total sample = 373. | |||||
| Year 2021 |
| Volume XXI Issue II Version I |
| ( ) C |
| Global Journal of Management and Business Research |
| Independent Variables | Symbol | Catego rical | Unit Measurement | Expected outcome(+/-) |
| Employee qualification and manpower | ESMP | Scale | Likert-type scale(strongly disagree, Disagree, Neutral, Agree, strongly agree) | + |
| Management Commitment | MCOMT | Scale | Likert-type scale | + |
| Taxpayers Registration | TREG | Scale | Likert-type scale | + |
| Technology and Information system | ITS | Scale | Likert-type scale | + |
| Compliance cost | TCC | Scale | Likert-type scale(very low,low,fair,high,very high) | +/- |
| Tax Knowledge | TKNOW | Scale | Likert-type scale | + |
| Tax Fairness | TFAIR | Scale | Likert-type scale | - |
| Dependent Variables | Measures | Expected outcome (+/-) | ||
| Turnover tax performances | TOTP | Continu ous | Tax ratio | +/- |
| Source: Own literature review (2019 |
| : Response rate | |||
| NO. | Questionnaire | Frequency | Percent |
| Administered | 361 | 100% | |
| 1 | Returned | 325 | 90% |
| 2 | Non-returned | 36 | 10% |
| Source: Field survey, February, 2019 | |||
| b) Factor Analysis | of the factors discovered | ||
| Factor analysis measured by Bartlett's test and | |||
| Kaiser-Meyer-Olkin (KMO) which occur 0 to 1, 0.5 was | |||
| tested variable. Factor-loadings are those values which | |||
| explain how closely the variables are related to each one | |||
| Variable | Kaiser-Meyer-Olkin Measure of Sampling Adequacy. | .836 | |
| Approx. Chi-Square | 692.539 | ||
| EQMP | Bartlett's Test of Sphericity | Df Sig. | 5 .001 |
| Kaiser-Meyer-Olkin Measure of Sampling Adequacy. | .827 | ||
| Approx. Chi-Square | 734.180 | ||
| MCOMT | Bartlett's Test of Sphericity | Df | 15 |
| Sig. | .002 | ||
| Kaiser-Meyer-Olkin Measure of Sampling Adequacy. | .800 | ||
| Approx. Chi-Square | 618.925 | ||
| TREG | Bartlett's Test of Sphericity | Df | 11 |
| Sig. | .000 | ||
| Kaiser-Meyer-Olkin Measure of Sampling Adequacy. | .756 | ||
| Approx. Chi-Square | 835.007 | ||
| ITS | Bartlett's Test of Sphericity | Df | 8 |
| Sig. | .000 | ||
| Kaiser-Meyer-Olkin Measure of Sampling Adequacy. | .790 | ||
| Approx. Chi-Square | 888.428 | ||
| TCC | Bartlett's Test of Sphericity | Df | 7 |
| Sig. | .001 | ||
| Kaiser-Meyer-Olkin Measure of Sampling Adequacy. | .787 | ||
| Approx. Chi-Square | 714.738 | ||
| TKNOW | Bartlett's Test of Sphericity | Df | 4 |
| Sig. | .005 | ||
| Kaiser-Meyer-Olkin Measure of Sampling Adequacy. | .811 | ||
| Approx. Chi-Square | 915.548 | ||
| TFAIRN | Bartlett's Test of Sphericity | Df | 9 |
| Sig. | .000 | ||
| Variable |
| 4: Continued Factor Loading | |||
| Variable | Factor Loading | ||
| Taxpayers have adequate tax knowledge on the consequences of not voluntarily registering for TOT. | .855 | ||
| TKNOW | Tax official have inadequate advice knowledge of tax laws and their respective regulations. Taxpayers have developed their obligation and good culture in their environment for payment of tax. | .876 .816 | |
| I have little idea about the tax rate that I can claim as taxpayers in the computations of my tax liability. | .724 | ||
| The trust of taxpayers doesn't determine tax compliance. | .679 | ||
| I pay my tax liability whether the tax administration of the tax system unfairly and not transparent. | .801 | ||
| TFAIRN | |||
| I did not believe that income in relation to benefits that you received. | .832 | ||
| Personally, would you agree that the perception ofcurrent income affects your | |||
| decision to under report your income? | .842 | ||
| Source: Field survey, February, 2019 | |||
| Factor loadings above 0.50 used. | |||
| c) Test relatesto Classical linear regression model | significant level, reject the Ho of no hetroskedasticity | ||
| Assumptions | otherwise fail reject it and accept alternative to exists | ||
| i. Test for Hetroskedasticity | hetroskedasticity. | ||
| According to white test value of chi square | |||
| calculated is greater than chi square tabulated given | |||
| Source: SPSS regression output |
| Model | R | R Square | Adjusted R Square | Std. Error of the Estimate |
| 1 | .567 a | .321 | .298 | .001499862 |
| Chi Square calculated and tabulated | ||||
| Test | Test t-statistics ? 2 calculated =nR 2 | ? 2 (5% sig. level) ? 2 ?(p), where p=xi+1 | ||
| White's test | 104 | 190.112 | ||
| Source: SPSS regression output | ||||
| The t-statistics value (chi square calculated) | ||||
| from table 4.6 above is 104 which a reless than chi | ||||
| square tabulated at 5% significant level, 190.112. Hence | ||||
| 104areless than 190.112fail and no hetroskedasticity. | ||||
| They have no treatment required for hetroskedasticity. | ||||
| Year 2021 | ||
| ( ) | ||
| Model | Collinearity Statistics Tolerance VIF | |
| (Constant) | ||
| ESMP | .715 | 1.398 |
| MCOMT | .495 | 2.022 |
| TREG | .575 | 1.738 |
| ITS | .562 | 1.779 |
| TCC | .616 | 1.623 |
| Source: Correlation matrix result by the researcher accordingly, | |
| 1. The correlation between TOT performance and | register machines are crucial TOT income collection |
| employee qualification and manpower positive | use each firms in woreda. |
| (0.462**) with p-value 0.000< 0.05. Thus employee | 5. The correlation between turnover tax performance |
| qualification and manpower had 46.2% positive | and tax compliance cost is negative and weak close |
| relationship with TOT performance. | to zero (0.232*) with p-value 0.000< 0.05. Thus tax |
| 2. The correlation between TOT performance and | compliance cost had 23.2% negative relationship |
| management commitment level is positive (0.414**) | with TOT performance. |
| with p-value 0.000< 0.05. Thus management | 6. The correlation between turnover tax performance |
| commitment level had 41.4% positive relationship | and tax knowledge is positive and strong (0.448**) |
| with TOT performance. | with p-value 0.000< 0.05. Thus tax knowledge had |
| 3. The correlation between turnover tax performance | 44.8% positive relationship with TOT performance. |
| and taxpayers registration is positive (0.449**) with | 7. The correlation between turnover tax performance |
| p-value 0.000< 0.05. Thus taxpayer's registration | and tax fairness is strong negative (0.472**) with p- |
| had 44.9% positive relationship with TOT | value 0.000 <0.05. Thus tax fairness had 47.2% |
| performance. | negative relationship with TOT performance. |
| 4. The correlation between TOT performance and technology and information system is positive and strong (0.454**) with p-value 0.000< 0.05. This more technological factor such as electronic tax | ii. Test for Model summary A small value of R 2 casts was doubt about the usefulness of the regression equation. |
| 9: Model Summary | ||||
| Model | R | R Square Adjusted R Square | Std. Error of the Estimate | |
| 1 | .720 a | .518 | .501 | .555 |
| Source: SPSS regression output by the researcher | ||||
| From outcome of the value of R square was | ||||
| (0.518)51.8 percent of deviations in turnover tax | ||||
| collection are caused by changes explanatory | ||||
| variable.48.2 percent of the variations in turnover tax | ||||
| collection not included in the model in revenue authority. | ||||
| ANOVA a | ||||||
| Model | Sum of Squares | Df | Mean Square | F | Sig. | |
| Regression | 103.532 | 11 | 9.412 | 30.573 | .000 b | |
| 1 | Residual | 96.357 | 313 | .308 | ||
| Total | 199.889 | 324 | ||||
| a. Dependent Variable: TOTRP | ||||||
| Source: SPSS regression output by the researcher | ||||||
| Unstandardized | Standardized | ||||
| Model | Coefficients | Coefficients | T | Sig. | |
| B | Std. Error | Beta | |||
| (Constant) | 86.462 | .204 | 423.417 | .000*** | |
| ESMP | .133 | .034 | .180 | 3.873 | .000*** |
| MCOMT | .146 | .032 | .257 | 4.597 | .000*** |
| TREG | .161 | .041 | .205 | 3.968 | .000*** |
| ITS | .142 | .036 | .208 | 3.981 | .000*** |
| TCC | -.043 | .044 | -.052 | -1.035 | .301 |
| TKNOW | .102 | .037 | .132 | 2.773 | .006*** |
| TFAIR | -.100 | .025 | -.169 | -3.988 | .000*** |
| Source: SPSS regression output by the researcher | |||||