uman Resource Management (HRM) is regarded as the significant department for talent
management.
The talented employees compulsorily considered as assets in the organization which
can be effective through acquisition, development, motivation and maintenance integrated
from all units of the bank. HRD selects the right kind of personnel for the committed
posts. In addition to this, HRD maintains talent human resources for the bank by applying
various motivational techniques and HRs considered as soft assets (www.ventureline.com).
Since bank is a service industry, this is why, its sustainability and competitive
opportunities depends on how HR Department utilize their potentialities and competencies.
The need of talent employees is well recognized in all events of global financial
crisis (2007)(2008) that was mostly connected with ambitious and ineffectual investment decision by the
banks (Islam et al, 2017). Bangladesh Bank (BB) and Ministry of Finance (MoF) emphasized to ensure better HRM
in the banking sector of Bangladesh through circulars (BB & MoF, 2015). The circulars are associated with rules and regulations, maintaining banking hours,
salaries and incentives, leave and performance appraisal of female employees.
Motivation means inspiring people to work continuation. Motivated employees do have
best quality of performance. Employees' motivation is affected by various factors.
The total environment of the banking industry has become changed due to face the competitive
sustainability. Basic pay, gross pay, designation, promotion, scoring of banking diploma
for promotion, experiences, location or posting, types of bank etc. are the issues
of demographic factors. Designation and gross pay are highly correlated for motivation.
Different emerging theories of motivation support that age, experience, pay, designation
etc. affect the motivation. Work experience relates the holding position through up
gradation in the organization. Maslow's need hierarchy theory proves the said issues
of demographic (Maslow, 1954). On the other supportive part of the Two-Factor Model namely Hygiene and Motivating
factors. Employees can enjoy these factors related to opportunities over a long-term
service the organization (Herzberg, 1959(Herzberg, , 1987)). The Two Factor Theory states that human needs are ordered in a series of levels
of the hierarchy accordance to importance which creates motivation. Alderfer's (1969) ERG theory chains Need-Hierarchy and Two-Factor Theory of motivation. Existence (E)
chains the basic need and job security, relatedness (R) actually related to social
needs and growth (G) is supportive with status and highest level achievement. If a
higher order need constants or unfulfilled, an individual can degenerate to lower
order needs which cause satisfy easily. Mc Clellend's Three Needs Model (1961) is also supportive to Needs Theory of Maslow whereas it can be seen that need for
affiliation (social need), need for power related to ego/status and remaining one
that is need for achievement connected to challenging achievement. An employer does
have the ability to understand the needs so as to meet these needs having a better
chance of involving and retaining talent employees. A survey conducted by Watson Wyatt
Worldwide showed that 71% people deliberate money as the main reason to stay as followed
by promotion prospect (33%) (Endress, 2007). Abraham Harold Maslow suggested a theory that delineated five hierarchical needs
which could also be functional to an organization and its employees' performance (Gordon, 1965). Without one of the lower ones the second need could be achieved or satisfied. Maslow's
needs theory is static imperative and applicable in today's business organizations,
for every organization that seek to obtain success and excellence reflects positively
the organizational culture, HRM and the employee's productivity, to attain organizational
excellence and create good environment, better and enjoyable work environment and
achieve goal at the right time then a effort and application of the theory is supreme
(Jerome, 2013). When an organization tries to know what drives personnel to work more, it is in
a better position to influence them to perform well (Kovach, 1987). Again it clarifies that employees performance can be examined by three indicators
namely ability, workplace environment, and motivation (Griffin, 1990). It is critical job for the managers in terms of motivating subordinates since it
is noticed that there globally changes in demographic factors, as well as highly advanced
technology (Wiley, 1997). This only emphasized the need to explore what motivates employees in order to get
better performance. The author highlighted the most and less important factors of
motivation in workplace from the earlier management. The most important factors in
1946 (appreciation), 1980 (interesting work), 1986 (interesting work) and 1992 (good
wages) and less important factors were in 1946 (discipline), 1980 (discipline), 1986
(personal problems), and 1992 (personal problems). The study received the most striking
findings that money and job security are the clear indicators of motivation. The effective
pay program, a primary motivating factor is critical due to individuals and psychological
possessions. It is does have immaterial value of the reward, but the increase in self-regard
that public recognition accompanying with monetary compensation affords (Dawson and Dawson, 1990). In the past, huge numbers of research studies on employee motivation in the different
perspectives already conducted. Very few of them were conducted relating to demographic
composition with motivation. The present paper stressed to observe the influential
factors of motivation with the sources variables of demographic issues among the employees
in the sampled banks. The study also designed to explore the most effective factors
in motivation.
Research questions: Does demographic composition affect employee motivation in the
banking sector?
Objective of the study: The main objective of the study was to scan effective factors
in demographic and motivating focuses among the employees of the banking sector in
Bangladesh.
2. II.
3. Research Framework
4. Results and Discussion
5. Global Journal of Management and Business Research
Volume XX Issue XIII Version I Year 2020 ( ) Remarks: The fitted linear regression
model for working experience (year) and other independent variables listed. The model
is good fit for this dataset and the coefficient of multiple determinations R 2 is
0.942 (Table 2). Since the R 2 ~ 0.94 then the dependent variable work experience 94% explained
by the independent variables/predictors. Hypothesis: The null hypothesis, H 0 :
B 0 = B 1 = B 2 =???..= B 13 =0
The alternative hypothesis, H 1 :
B 0 = B 1 = B 2 =???..= B 13 ?0
Remarks: From the Table 3 ANOVA table the fitted regression model F-test statistic value is 483.944 and the
significance value (p value) 0.000 which is less than 0.05 (p value<?). Then all the
regression coefficients were statistically highly significant at 5% level of significance.
That is the null hypothesis is rejected and alternative hypothesis is accepted. Therefore,
all the regression coefficients were not zero (0).
6. Remarks:
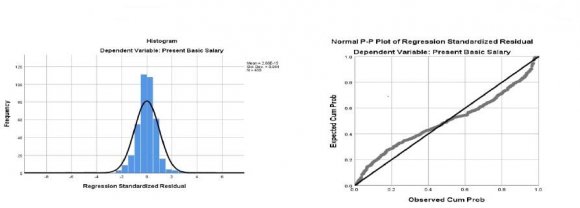
The above fitted linear regression model (Table 5) for present basic salary and other independent variables listed. The model is good
fit for this dataset and the coefficient of multiple determinations R 2 is 0.769.
Since the R 2 ~ 0.769 then the dependent variable present basic salary 76.9% or about
77% explained by the independent variables/predictors mentioned above. Hypothesis:
The null hypothesis, H 0 :
B 0 = B 1 = B 2 =???..= B 13 =0
The alternative hypothesis, H 1 :
B 0 = B 1 = B 2 =???..= B 13 ?0
Remarks: From the ( Therefore, all the regression coefficients were not zero (0).
Remarks: From the fitted histogram (Figure 3 & 4) showed the bell shape curve and Q-Q (quantilequantile) plot the fitted residual
line passing through the origin. Therefore, the dependent variable Present Basic Salary
is normally distributed and the linear regression model best fit for this dataset.
7. Remarks:
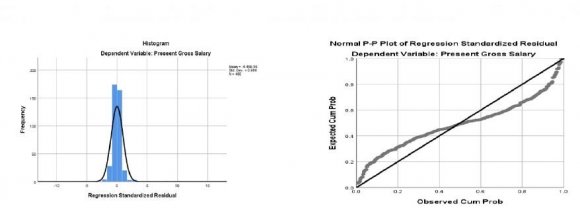
The fitted linear regression model (Table 8) for Present Gross Salary and other independent variables listed above. The model
is good fit for this dataset and the coefficient of multiple determinations R 2 is
0.682.
Since the R 2 ~ 0.682 then the dependent variable present gross salary 68.2% explained
by the independent variables/predictors. Remarks: From the (Table 9) ANOVA (Analysis of Variance) table the fitted regression model F-test statistic
value is 63.742 and the significance value (p value) 0.000. Then all the regression
coefficients were statistically highly significant at 5% level of significance. That
is, alternative hypothesis is accepted. Therefore, all the regression coefficients
were not zero (0). Remarks: From the ANOVA Table 12 the fitted regression model F-test statistic value is 26.857 and the significance
value (p value) 0.000. Then all the regression coefficients were statistically significant
at 5% level of significance. That is the null hypothesis is rejected and alternative
hypothesis is accepted. Therefore, all the regression coefficients were not zero (0).
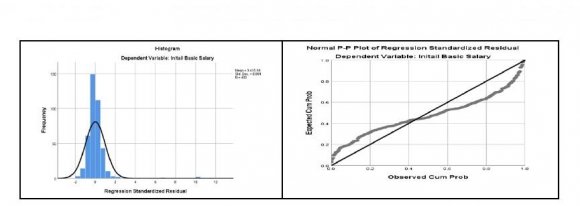
Remarks: From the Figure 7 & 8 depict that the fitted histogram showed the bell shape curve and Q-Q (quantile-quantile)
plot the fitted residual line passing through the origin. Therefore, the dependent
variable initial basic salary is normally distributed and the linear regression model
best fit for this dataset. Overall it can be explained that employees are in the
service of the banking sector influenced by the age, experience, present designation,
joining post, type of bank, present and initial gross. There were strong relationships
among these control or sources variables in the study. Gender did not affect the satisfaction
of the bank employees. Among these factors the most effective factors were age and
present designation (standardized Beta coefficient value 0.663 and 0.571). On the
other hand, banking diploma mostly affects the promotion in case of public bank.
8. First joining designation
It is evident from the Table 18 work experience is 94% explained by variance whereas age is strongly associated with
job experience. Present basic salary 77% is explained by total predictors and it is
highly affected by present designation of the existing employees. Present gross salary
68.2% is varied by the estimators and it is mostly influenced by present position
of an employee. Initial basic salary is 47.5% ~48% explained by variance and is prejudiced
by first joining designation. Initial gross salary 35.1% is explained by total variance
and it is strongly affected by employees' first joining designation. Therefore, employees'
motivation of the banking sector of Bangladesh is highly associated with work experience,
present and initial salaries which are mostly modified by age, present and initial
designation. Finally, equation may be Employee Motivation = f (Age + Present designation
+ Initial designation).
V.
9. Concluding Remarks
Motivation is a complex to determine its level. The study found from the empirical
analysis based on demographic outlined that the most effective factors age, present
designation, first joining designation were explored and strongly associated with
employee motivation in the banking sector of Bangladesh. Sample area, job experience
and pay were considered only which may confine the scope of the study. Lack of huge
context of the research is another limitation in the paper. Further study should emphasize
in a larger scale of employee perception concentrating on job security and money or
pay intrinsically as well as extrinsically.
Note: a. Predictors: (Constant), Banking Diploma, Group/ Subject, Gender, Religion, Educational
Qualification, Marital Status, Location (District), Type of Bank, Present Designation,
First joining designation/post, Name of the Bank, Age, Location (Upazilla). b. Dependent
Variable: Working experience (year).
Figure 8. Table 3 :3
Model
Sum of Squares
df
Mean Square
F
Sig.
Regression
47261.760
13
3635.520
483.944
0.000 b
1
Residual
2899.737
386
7.512
Total
50161.498
399
Note: a. Dependent Variable: Working experience (year) b. Predictors: (Constant), Banking
Diploma, Group/ Subject, Gender, Religion, Educational Qualification, Marital Status,
Location (District), Type of Bank, Present Designation, First joining designation/post,
Name of the Bank, Age, Location (Upazilla).
Remarks: From the fitted (Table 4) the age, present
or major discipline does not directly affect motivation
designation, first joining designation, educational
(? 12 ) =0.001 and p value is 0.996. Among the significant
qualification were statistically significance at 5% level of
independent predictors age (0.800) and present
significance. Therefore, employees' motivation is
designation (1.294) were positive contribution on the
exaggerated by the control variable namely age,
dependent variable working experience (year).
designation, and educational qualification. The subject
Figure 10.
Std. Err. of
Change Statistics
Model
R
R 2
Adjusted R 2
the Estimates
R 2
F change
df1
df2
Sig. F
1
0.877 a
0.769
0.762
6987.86
0.769
99.1
13
386
0.000
a. Predictors: (
Note: (District), Type of Bank, Present Designation, First joining designation/post, Name
of the Bank, Age, Location (Upazilla). a.Dependent Variable: Present Basic Salary.
Figure 11. Table 6 :6
Model
Sum of Squares
df
Mean Square
F
Sig.
Regression
62872948092.258
13
4836380622.481
99.045
0.000 b
1
Residual
18848472031.68
386
48830238.424
Total
81721420123.94
399
a. Dependent Variable: Present Basic Salary
b. Predictors: (
Figure 12. Table 66
) ANOVA (Analysis of
statistically strongly significant at 5% level of
Variance) table the fitted regression model F-test
significance. That is alternative hypothesis is accepted.
statistic value is 99.045 and the significance value (p
value) 0.000. Then all the regression coefficients were
Remarks: From the (Table 10) fitted the age, present
designation, first joins designation, educational
qualification were statistically significance at 5% level of
significance. Among the significant independent
predictors age (1244.412), present designation
Note: (10226.033), first joining designation/post (3129.422) and type of bank (15523.420)
were positive contribution to the dependent variable Present Gross Salary. Therefore,
there is a strong association among age,
Figure 18. Table 11 :11
Model
R
R 2
Adjusted R 2
Std. Err. of the Estimates
R 2
Change Statistics F change df1 df2
Sig. F
1
0.689 a
0.475
0.457
5713.00316
0.475
26.857
13
386
0.000
a. Predictors: (
Note: b. Dependent Variable: Initial basic salaryRemarks:The fitted linear regression model
(
Figure 19. Table 1111
)
Figure 20. Table 13 :13
Year 2020
8
Volume XX Issue XIII Version I
)
A
(
Global Journal of Management and Business Research
Note: * ?????????? ???? ?????????????? ? 199.290 * ?????????????? ?????????????? Comment:
From the fitted coefficients (Table13) the, first name of the bank were statistically
significance at 5% level of significance. Among the significant independent predictors
first joining designation/post (2220.853) and name of bank (1064.391) were positive
contribution to the dependent variable Initial Basic Salary.
Age (?=0.663), present designation (? = 0.152) Present designation (?=0.571), age
(?=0.461), and first joining designation (?=0.256) Present designation (?=0.503),
age (?=0.432), type of bank (?=0.232)and first joining designation (?=0.225) First
joining designation (?=0.551), and Name of the bank (?=0.326) First joining designation
(?=0.519), and Name of the bank (?=0.337)
Age Present designation Present designation First joining designation
The author of this article is grateful to the honorable Professor Dr. Md. Omar Faruk
Sarker (PhD Supervisor of the author), Marketing Department, & Dr. Md. Kamruzzaman
(PhD Co-Supervisor of the author), Associate Professor (Statistics), IBS, University
of Rajshahi, Bangladesh.
Appendix B
Appendix B.1
Remarks: From the Table 15 (ANOVA) the fitted regression model F-test statistic value is 16.058 and the significance
value (p value) 0.000. Then all the regression coefficients were statistically significant
at 5% level of significance. That is the null hypothesis is rejected. Therefore, all
the regression coefficients were not zero (0). 16 the study observed that present designation, first joining and name of the bank were
statistically significance at 5% level of significance. Among the significant independent
predictors first joining designation/post (4425.217)and name of bank (2449.083) were
positively affected the dependent variable Initial Basic Salary.
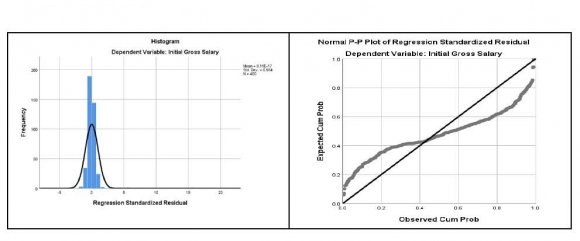
Remarks: From the fitted histogram (Figure 9 & 10) showed the bell shape curve and Q-Q (quantilequantile) plot the fitted residual
line passing through the origin. Therefore, the dependent variable initial gross salary
is normally distributed and the linear regression model best fit for this dataset.
Appendix C
,
BRPD Circular LetterJune 2015. (07) p. 17.
Motivation and Personality,
A H Maslow
. 1954. NY: Harper.
An empirical test of a new theory of human needs.
C Alderfer
, P
. 10.1016/0030-5073.
Organizational Behavior and Human Performance1969. 4 (2) p. 90004.
What motivates employees according to over 40 years motivation surveys.
C Wiley
. International Journal of Manpower1997. 18 p. .
D Mc Clellend
. The Achieving Society,
(NY )
1961. The Free Press.
Workers' needs: the same around the world,
F Herzberg
. 1987. Industry Week. p. .
The relationship of satisfiers and dissatisfiers to productivity, turnover and morale.
G Gordon
. American Psychologist1965. 20 p. .
Global Journal of Management and Business Research Volume XX Issue XIII Version I
Year 2020,
What motivates employees? Workers and supervisors give different answers.
K Kovach
, A
. Business Horizons1987. 30 (5) p. .
The cure for employee malaise-motivation.
K M Dawson
, S N Dawson
. Clinical Laboratory Management Review1991. 5 p. 302.
Human Resource of Banks.
M Islam
, T Haque
, M
, M Yesmin
, R Ismal
, M
, R Islam
, M
, M
. Banking Review Series2017. p. 292.
Application of the Maslow's hierarchy of need theory; impacts and implications on
organizational culture, human resource and employee's performance.
Nyameh Jerome
, N
. International Journal of Business and Management Invention2013. 2 (3) p. .
How to hire and retain top talent,
P Endress
. 2007. p. .
,
R W Griffin
. Management1990. Houghton Mifflin Company. p. 437.
(3rd ed.)