1. Introduction
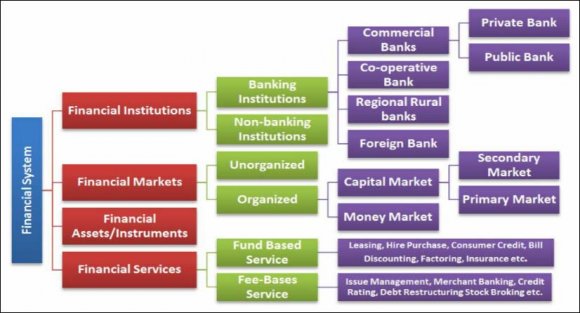
ross Domestic Product (GDP) is the total monetary or market value of all the finished goods and services produced within a country's borders in a specific time period. As a broad measure of overall domestic production, it functions as a comprehensive scorecard of the country's economic health. (Chappelow, Gross Domestic Product-GDP, 2019). An IMF publication states that, "GDP measures the monetary value of final goods and services that are bought by the final user produced in a country in a given period of time (say a quarter or a year)." (Chappelow, J., 2019). A financial system plays a vital role in the economic growth of the country. It intermediate between the flow of funds belonging to those who save a part of their income and those who invest in productive assets. It mobilizes and usefully allocates scare resources of a country. A financial system is a complex, well-integrated set of sub systems of financial institution, market, instrument, and services which facilitate the transfer and allocation of funds, efficiently and effectively. The Indian financial system can also be broadly classified into the formal (organized) financial system and informal (unorganized) financial system. The formal financial system comes under the preview of the Ministry of Finance (MoF), the Reserve Bank of India (RBI), the Securities and Exchange Board of India (SEBI), and other regulatory bodies. (Chen, J., 2019) Though GDP is usually calculated on an annual basis, it can be calculated on a quarterly basis as well. In India, for example, the government releases an annualized GDP estimate for each quarter and also for an entire year. Most of the individual data sets will also be given in real terms, meaning that the data is adjusted for price changes, and is, therefore, net of inflation. (CHAPPELOW, Gross Domestic Product-GDP, 2019) (Chappelow, J., 2019) G (Sources: https://www.investopedia.com/terms/f/financialsystem.asp) The study adopted the Vector Error Correction Model (VECM) methodology in estimating the long run and short run relationship among the Variables. The study started by testing for stationary of the data, and when variables were found to be stationary only after taking their first difference, the Johansen Co integration test was adopted to determine whether or not the variables have long run relationship. Having found the variables to be co integrated, the VECM model was run where the short run relationship among the variables and short run dynamics of the model were estimated. As a further tool of analysis, impulse response function (IRF) was also adopted by the study. Findings of the study showed stock market to have a negative effect on economic growth in the long run, while in the short run, it is found to have a positive effect on economic growth of India. The short run impact can be attributed to it being a source of finance to enterprises, but however, the long run negative impact of stock market development can be viewed from the angle of its high level of volatility and casino-like operation which entails a lot of speculative activities. But can stock market declines actually affect future growth? There is some evidence that they can through the credit channel. The researchers conclude that This Economic Commentary has reviewed the reasons why stock prices and real GDP may be correlated. In doing so we have emphasized that firms' balance-sheet effects may be important in understanding output growth. To understand this channel we sometimes treated stock price changes as occurring for some exogenous reason, like the bursting of a stock market bubble, and examined why this would affect investment and output. Of course, stock price changes very rarely occur without a change in some fundamental economic variables. Reality is likely a synthesis of both scenarios: Future GDP growth affects current stock prices, and this change in stock prices affects future GDP growth. Most people view the credit channel as explaining how the feedback effects. under study in the research. Interviews with experts will be undertaken if necessary to tap the unknown facts and figures of what I think might have been missing in the data. The main objective of the study is to study the relationship between stock market returns with respect to inflation, GDP and interest rates and To find the strength of the relation between stock market returns with respect to inflation and GDP. The researcher will also use regression, correlation to find out the nature and strength of the relationship between the variables under study. An important finding is that the explanatory variables in the model result in 95.6% influence on the stock prices of quoted companies for the period 1997-2006. It also provides preliminary evidence regarding the relative importance of the explanatory variables on stock prices of quoted companies. Specifically, the findings suggest that RDGP was the most important variable influencing stock prices. Conclusively, government should implement policies that will reduce inflation rate and poverty level through infrastructural development and improved standard of living. Also, interest rates should be made moderate in order to encourage investment and transactions in the stock market. (D. V. Lokeswar The Study on Impact of BSE SENSEX Index on GDP growth rate shows that, SENSEX Index of BSE is significantly affected on growth rate of GDP. BSE SENSEX Index is increased, and then growth rate in GDP is also increased. Correlation between both variable is significant i.e. 0.0937 shows the positive relationship. Specifically, the findings suggest that role of stock market (BSE SENSEX Index) is one of the most important influencing factors of GDP and vice a versa. So, the GDP is predictable variables for Indian stock market returns. Conclusively, the government should try to maintain the growth rates of GDP and liquidity in the primary, secondary and derivatives market of stock market. (Kishorsinh & Mahendrakumar, 2018) III.
2. Problem of the Study
The stock market is a general term used to refer to an organized exchange where shares of stock are traded. The movement of stock market depends on the rational well as the irrational behaviour of the investor. The most imposing role of stock market is to work as a relationship between savers and borrowers. This helpful for the generation of saving form the huge group of small savers and these saving can be investment in profitable means. The investor and creditor liking together with stock market operation. The stock market engaged the reallocation of money from the different firm of the economy. Investors consider macroeconomic variables when they value stocks. Interest rates, exchange rate, inflation, GDP are very important among these macroeconomic variables which affect the performance of the stock market. A number of studies have been conducted to determine the relationship between the macroeconomic variable and stock prices in the past. The findings of these studies show that there is a strong relationship between macroeconomic variable and stock prices. Some studies showed no relationship between the economies and the financial markets of less developed countries, like Asian markets, Fung and Lie (1990) explained this by saying that "macroeconomic factors can't be reliable indicators for stock market price movements in the Asian markets because of the inability of stock markets to fully capture information about the change in macroeconomic fundamentals."
There are many debatable opinions on the relationship between the GDP and stock market movement. Hence a study will be undertaken to observe the impact of GDP on stock market movement and the relationship between GDP and stock market movement. Therefore, the statement of problem for this research is..
3. IV.
Objectives of the Study a) Specifically these are the main objectives of the study 1. To find out the relationship between gross domestic products (GDP) and stock market movement in India. 2. To know the impact of gross domestic products (GDP) on the stock market movement in India. 3. To know the impact GDP on stock market as a macroeconomic variable.
4. Global Journal of Management and Business Research
Volume XX Issue VIII Version I Year 2020 ( ) referred to support the formation of certain conceptual definitions and depth knowledge of the subject. Journals, Magazines and newspapers will be used to accumulate the latest information about the variable V.
Hypothesis of the Study There is a significant relationship between GDP and SENSEX. H 0
There is no significant relationship between GDP and SENSEX. H 1
There is a significant relationship between GDP and NIFTY 50. H 0
There is no significant relationship between GDP and NIFTY 50.
H 1There is an Impact of GDP on SENSEX. H 0
There is no impact of GDP on SENSEX.
H 1There is an Impact of GDP on NIFTY 50. H 0
There is no impact of GDP on NIFTY 50.
5. Data Analysis
6. Simple Linear Regression Model
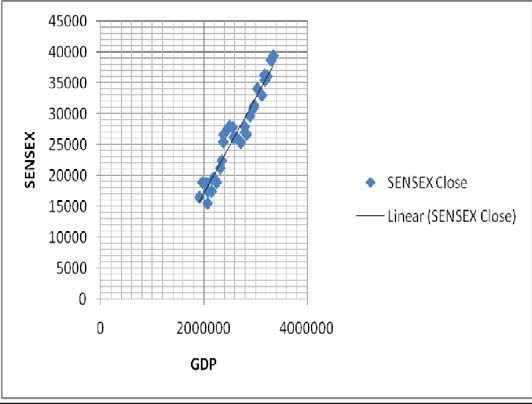
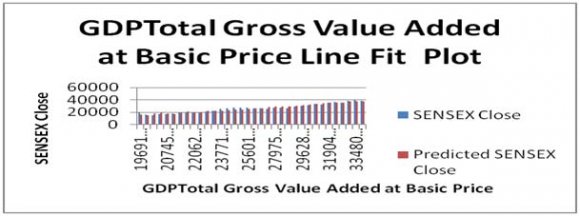
Regression analysis between GDP and SENSEX Hypothesis of the study Regression Analysis between GDP and BSE SENSEX Index shows there is positive significant correlation between these two Variables. From the above ANOVA table f cal-value (443.53) is more than the f tabulated value (2.55676E-20). So, we fail to accept the null hypothesis at 5% level of significance. We can say that, there is an impact of GDP on BSE SENSEX Index. As per the above table we observe that p-value (4.40084E-08) in ANOVA table is less than 0.05 at the level of 5% significance. Therefore the H0 (null hypothesis is) rejected. So we conclude that there is a significant impact of GDP on BSE SENSEX index.
7. b) Interpretation
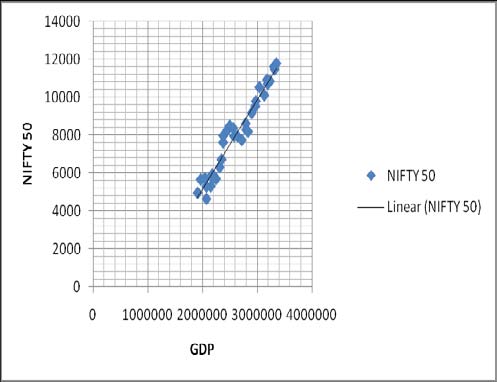
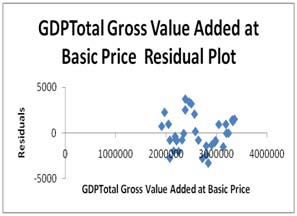
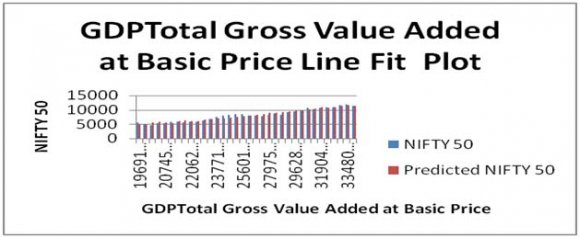
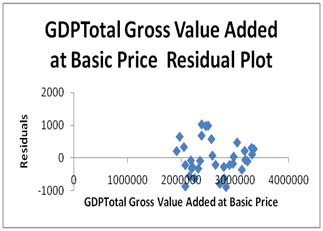
Regression Analysis between GDP and NSE NIFTY 50 Index shows there is positive significant correlation between these two Variables. From the above ANOVA table f cal-value (524.7529) is more than the f tabulated value (2.04E-21). So, we fail to accept the null hypothesis at 5% level of significance. We can say that, there is an impact of GDP on NSE NIFTY 50 Index. As per the above table we observe that p-value (5.35E-09) in ANOVA table is less than 0.05 at the level of 5% significance. Therefore the H0 (null hypothesis is) rejected. So we conclude that there is a significant impact of GDP on NSE NIFTY 50 index. c) Interpretation Regression Analysis between GDP and NSE NIFTY 50 Index shows there is positive significant correlation between these two Variables. From the above ANOVA table f cal-value (524.7529) is more than the f tabulated value (2.04E-21). So, we fail to accept the null hypothesis at 5% level of significance. We can say that, there is an impact of GDP on NSE NIFTY 50 Index.
As per the above table we observe that p-value (5.35E-09) in ANOVA table is less than 0.05 at the level of 5% significance. Therefore the H0 (null hypothesis is) rejected. So we conclude that there is a significant impact of GDP on NSE NIFTY 50 index.
| , 2012) |
| Kishorsinh, N. C., & Mahendrakumar, T. S. |
| (2018) have analyzed the Impact of Gross Domestic |
| Products (GDP) on Stock Market Returns in India. The |
| researcher's have collected data from the official |
| website of BSE (Bombay Stock Exchange). Data of GDP |
| growth rate is collected from World Bank Reports and |
| other websites, |
| Year 2020 | ||||||||
| Volume XX Issue VIII Version I | ||||||||
| ( ) | ||||||||
| Global Journal of Management and Business Research | YEARS 2011-12 2012-13 2013-14 2014-15 | QUARTERS Q1 Q2 Q3 Q4 Q1 Q2 Q3 Q4 Q1 Q2 Q3 Q4 Q1 Q2 Q3 Q4 | GDP 1969132 1913207 2073896 2150712 2074589 2047909 2177528 2246251 2206230 2193897 2314941 2348579 2377154 2379356 2457010 2498612 | SENSEX 18845.87 16453.76 15454.92 17404.2 17429.98 18762.74 19426.71 18835.77 19395.81 19379.77 21170.68 22386.27 25413.78 26630.51 27499.42 27957.49 | YEARS 2016-17 2017-18 2018-19 2019-20 | QUARTERS Q3 Q4 Q1 Q2 Q3 Q4 Q1 Q2 Q3 Q4 Q1 Q2 Q3 Q4 Q1 Q2 | GDP 2637004 2716448 2797534 2791258 2832025 2898152 2962815 2974645 3039403 3127303 3190452 3178747 3231406 3306332 3348005 3316377 | SENSEX 26117.54 25341.86 26999.72 27865.96 26626.46 29620.5 30921.61 31283.72 34056.83 32968.68 35423.48 36227.14 36068.33 38672.91 39394.64 38667.33 |
| 2015-16 | Q1 | 2560191 | 27780.83 | |||||
| Q2 | 2578225 | 26154.83 | ||||||
| (Sources: Wikipedia, Invest opedia, Websites of NSE and BSE etc) | ||||||||
| : CO- | GDP and NIFTY 50 | ||||||
| YEARS | QUARTERS | GDP | NIFTY50 | YEARS | QUARTERS | GDP | NIFTY50 |
| 2011-12 | Q1 | 1969132 | 5647.4 | Q3 | 2637004 | 7946.35 | |
| Q2 | 1913207 | 4943.25 | Q4 | 2716448 | 7738.4 | ||
| Q3 | 2073896 | 4624.3 | 2016-17 | Q1 | 2797534 | 8287.77 | |
| Q4 | 2150712 | 5295.55 | Q2 | 2791258 | 8611.15 | ||
| 2012-13 | Q1 | 2074589 | 5278.9 | Q3 | 2832025 | 8185.8 | |
| Q2 | 2047909 | 5703.3 | Q4 | 2898152 | 9173.75 | ||
| Q3 | 2177528 | 5905.1 | 2017-18 | Q1 | 2962815 | 9520.9 | |
| Q4 | 2246251 | 5682.55 | Q2 | 2974645 | 9788.6 | ||
| 2013-14 | Q1 | 2206230 | 5842.2 | Q3 | 3039403 | 10530.7 | |
| Q2 | 2193897 | 5735.3 | Q4 | 3127303 | 10113.7 | ||
| Q3 | 2314941 | 6304 | 2018-19 | Q1 | 3190452 | 10714.3 | |
| Q4 | 2348579 | 6704.2 | Q2 | 3178747 | 10930.45 | ||
| 2014-15 | Q1 | 2377154 | 7611.35 | Q3 | 3231406 | 10862.55 | |
| Q2 | 2379356 | 7964.8 | Q4 | 3306332 | 11623.9 | ||
| Q3 | 2457010 | 8282.7 | 2019-20 | Q1 | 3348005 | 11788.85 | |
| Q4 | 2498612 | 8491 | Q2 | 3316377 | 11474.45 | ||
| 2015-16 | Q1 | 2560191 | 8368.5 | ||||
| Q2 | 2578225 | 7948.9 | |||||
| Variable | R | 2 | Equation | P. value | Seg t 5% | H0(Accept/Reject) |
| SENSEX | 0.93 | Y=0.015-13852.9x | 4.40084E-08 | 0.05 | Rejected | |
| a) Interpretation | ||||||
| Variable | R | 2 | Equation | P. value | Seg t 5% | H0(Accept/Reject) |
| NIFTY 50 | 0.94 | Y=0.004727-4314.2x | 5.35E-09 | 0.05 | Rejected | |
| Variable | R | 2 | Equation | P. value | Seg t 5% | H0(Accept/Reject) |
| NIFTY 50 | 0.94 | Y=0.004727-4314.2x | 5.35E-09 | 0.05 | Rejected | |
| 41 | ||||||