1. INTRODUCTION
hina is the greatest economy, and the variances of the Chinese economy, of some other under creating nations likewise varies, because the generation of local and also numerous extravagance items are made by China for these nations. An enormous amount of their exchange relies upon Chinese imports. It tends to be said that now China becomes a monetary need of this world. The reasons of reliance of the world on Chinese items is that the production cost of these items is excessively low, even a few nations purchase numerous items from Chinese brokers because wherein cost they produce these items on that value they are selling those items imported China after paying import obligation, conduit charges, city duties, and every single other use. After 1960 Chinese economy supports up bit by bit, and after 1980, the Chinese economy development accelerates, and till 2019 development rate is too high. In any case, presently, in 2020, there is an obstacle made for the development of the Chinese economy known as novel coronas virus. The infection will have just a constrained negative financial effect. Its impact on The Chinese GDP development rate in 2020 is probably going to be little; maybe decay on the request for 0.1 rates point. In the quarter of 2020 will maybe bringing down development by one rate spot on a yearly principle. The consequence on humankind GDP growth will be much slighter (WEI, 2020) the Chinese's economy is more likely than not developing beneath that rate, and that the combined impacts of the present general wellbeing emergency will occur in general constrain the development rate yet inferior in close to tenure (Magnus, 2020). As Chinese individuals and China Govt. as of now had confronted such a sort of unforeseen occasion like coronas virus, which upset their economy in the past, they generally face these difficulties boldly and remained before all obstacles of movement joined together. The effect of the 2019-nCov disease (crown infection) explained in brief declare market analysts; however, inexorably portable Chinese populace chances the sickness spreading over the coming weeks (Howes, 2020). The Chinese economy isn't relied upon to endure an enormous or in any event, enduring hit, yet financial specialists are hesitant to put a gauge may be it will spread. Prof; Hu thought, effect starting of SARS was rational as well as didn't keep going extensive, cutting China's quarterly GDP progress by 2% rate focuses as of 11.1% every year to 9.1% throughout the second from last four months (Domm, 2020). China's "actual" GDP could be level, or even fall in January-March, because of the endeavors to contain the spread of the coronas virus, plant shutdowns, and frightful purchasers (BEAMISH, 2020). China's financial system has gotten increasingly incorporated toward remainder of world, and dynamic exchange happens whenever openings emerge (Chen T., 2013).
2. II.
3. LITERATURE REVIEW
A significant arrangement thought to expand pattern for the model of the information (Elsayir, 2018). Past expert determining, these redresses can help basic monetary leadership by private entertainers and approach producers. For the situation strategy making, a progressively refined picture of thing to come can improve full-scale prudential approaches. The wasteful utilization of data and the related blunders in basic leadership could clarify monetarily essentialness total variances (Aromí, 2017). New worldwide monetary "vulnerability" and macroeconomic information "shock" factors are, without a doubt, valuable, as they contain considerable negligible discerning substance for GDP development in EM economies, as appeared through a progression of continuous anticipating tests (Cepni, 2018). 1) Slowing the maturing pattern through relocation and pre-birth list strategies; 2) upgrading work power support through work advertise arrangements; and 3) expanding work efficiency by increasing human being resources and the prosperity of the workers, just while putting resources into mechanical development. Concerning the approach, al-however China has as of late loosened up its one-youngster strategy, open reaction, and the long haul sway on populace maturing are still of extraordinary vulnerability (Chi Leung Kwok, 2018). China fabricating vitality utilization will keep on indicating development patterns. It will arrive at 2.58 billion heaps of average energy. It preserves give indicators to plan of administration vitality procedure that supported development of financial matters in China (Cheng, 2015). In the following 30 years, during which China will confront fast populace maturing, keeping up consistent financial development calls for persistent and generous improvement in labor profitability. Our gauge of work profitability important to meet distinctive monetary development targets demonstrates that keeping up a yearly GDP development pace of 7% in excess of the period 2015-2045 (Chen, 2018). China's populace continued expanding in the previous sixty years, whereas its development ratio indicated descending pattern. Attributable, Chinese implementation of the single-kid strategy, gender proportions obtained twisted plus quantity of matured people expanded quickly (Naiming Xie, 2018). The significant pretended by a well-created lawful framework and require an improvement in the legitimate condition in Chinese securities exchanges. A superior created lawful framework could function admirably as an alleviating factor for one-sided estimates because in a superior created legitimate framework (Shengnian Wang, 2017). China's development is based on a huge arrangement of irregular characteristics segment, natural, monetary, social, and political. Chinese pioneers have been long mindful of this awkward nature and attempted to review them. Huge segments of the decision elites, especially the nearby governments and the SOEs, have personal stakes in those irregular characteristics, while a portion of the lopsided characteristics themselves are pivotal for the arrangement of China's progressively quick needs (Vuving, 2012). Further efficiency development will most likely require relentless and supported upgrades in the working of the key establishments of China's market economy and that will be more earnestly to achieve than were prior endeavors that basically included disassembling the old framework. These new endeavors require making as good as ever organizations beginning with the money related framework increasingly significant as time goes on (PERKINS, 2006). The idea of twofold patterns and offers help to basic leadership in business, particularly in tasks the board and showcasing. The conventional solitary sculpts and preset burden mix draws near, the original strategy may be deal with all kinds of instance arrangements devoid of confusing the sculpt construction (Luo, 2017). The gauging model utilizes dynamic factors and blended recurrence information and can completely and viably large scale, monetary and money related data, in this way, bringing about great estimate execution. The examination gives valuable references to the China government to situate GDP development targets, particularly throughout the present basic time monetary rebuilding as well as overhauling plus change of financial development model (Yu Jiang, 2017). Accord figures are the determinant of the conjecture mix in the period of their discharge, recommending that the peripheral data substance of the DFM estimates has gotten somewhat low for some nations. Therefore, the advantages from utilizing a mixed plot when estimated against new Consensus conjectures' presentation have commonly decreased after some time, and are for the most part, little or missing for all nations aside from Italy and Japan since 2008 (Winter, 2018). Specialists may utilize this quantitative data and assess the specialists' estimates in line up considers through individuals created by also foundation (on behalf of occurrence, IMF) or different reviews (consent finances or the review of expert predictors) (Wohlrabe, 2019). Misconstrue the quality of the auxiliary connections between the diverse macroeconomic factors. Multivariate gauges assist decide to what degree estimates genuinely mirror forecasters' private assurance. At the end of the day, multivariate figures can enable the market to frame increasingly precise evaluations of the anticipated factors (Deschamps, 2014).
4. III.
5. Methodology a) TIME Series Models i. AUTO-regressive Model
A period arrangement is grouping of estimations of the equivalent erratic(s) completed after some moment. Let us initially consider the issue where we have a y-variable estimated as a period arrangement, Y a proportion of temperature, with estimations yearly. To stress with estimated values after some moment, we use "t" because a subscript instead of the standard thing "I," i.e., Y t implies Y estimated in time period t. An auto-backward replica is a point at which an incentive from a period arrangement is on past qualities since to equivalent time arrangement. In support of instance, Y t on Y t ?1:
Y t = ?0+? y t ?1+?t(1)Right now, the reaction variable in the past times, and the blunders have our typical suspicions about mistakes in a straightforward, direct relapse model. The request for an auto-relapse is the quantity of promptly going before esteems in the arrangement to anticipate the incentive right now. In this way, the previous model is a 1 st request auto-relapse, composed like AR (1). In the event that we need to anticipate Y this year (Y t ) utilizing estimations of worldwide hotness in past 2 years (Y t ?1, Y t ?2), at that point the autobackward model is given:
Y t = ? 0 +? 1 Y t ?1+? 2 Y t ?2+ ? tThis model is a 2 nd request auto-relapse, composed as AR (2), because incentive by time t is anticipated, as of the qualities on occasion t?1 and t?2t?2. All the more by and large, a k th -request autorelapse, composed as AR(k), is a various straight relapse wherein the estimation of the arrangement whenever t is a (direct) capacity of the qualities on occasion t?1,t?2,? ,t?kt?1,t?2,? ,t?k.
6. I.
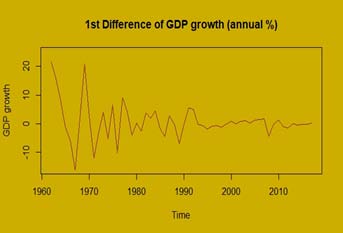
Incorporated. The consumption of dissimilarity of crude perceptions (for example subtracting, a perception from a perception at the past time step) the instance arrangement inactive.
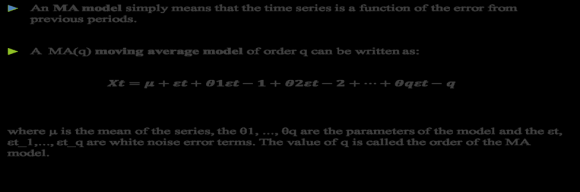
MA: Moving Average. A replica that employs the dependence among an insight remaining an affecting normal mock-up practical to slacked perceptions. A average certification is utilized for ARIMA (p,d,q) anywhere the strictures are subbed by whole figure characters to quickly display the exacting an ARIMA model.
The limitations of the ARIMA model are distinguished as tracked: p: The number of sagging observations considered for the model, similarly described the relaxed request. d: The circumstances that the crude perceptions the intensity of variation. q: The amount of the affecting window.
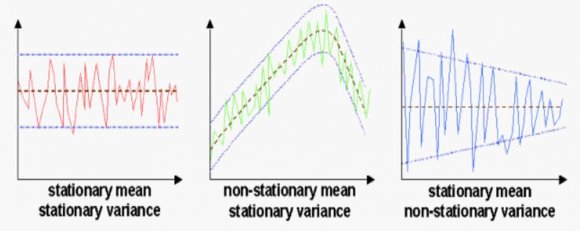
7. c) Stationary
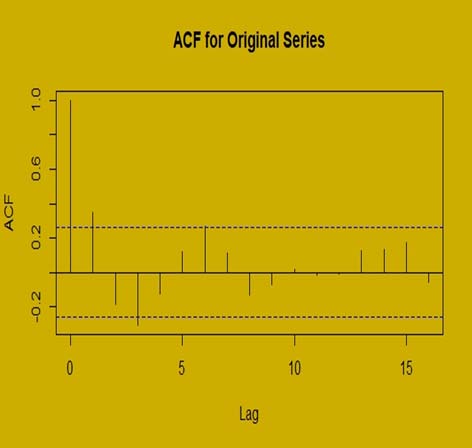
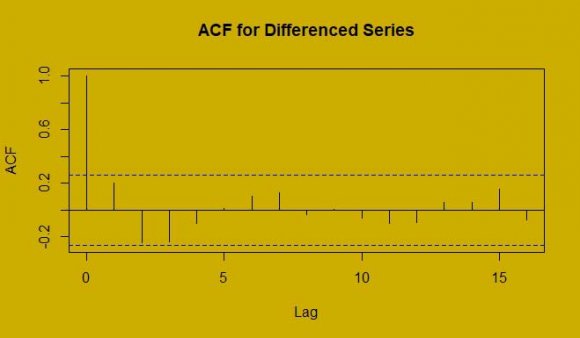
Ordinary hypotheses in numerous time series methods are to the figures are stationary. A stationary procedure has the possessions to the mean, variation, and auto-correlation structures do not modify more than time. Stationary can be distinct in accurate arithmetical requisites, however in favor of our principle we denote a horizontal emerge series, lacking tendency, steady variation in excess of occasion, a invariable autocorrelation organization more than occasion and no interrupted variations.
8. Global Journal of Management and Business Research
9. V. CONCLUSION
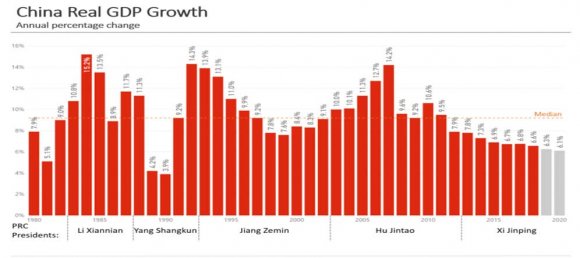
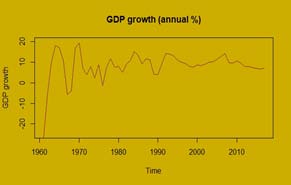
China encounters a record 19.3% yearly development rate in 1970. Just in ten years from 1960-70 china support the economy from negative to positive and gained a colossal ground. By changes in nation financial matters with the progression, China encountered a high GDP rate as all things considered approximately 10%. Accomplishing such a high GDP rate for such a long time makes China monetarily increasingly stable nation on the planet, and one of the fundamental explanations of getting consideration of the world. We see from the future foresting that the GDF of china is progressively steady and reliable. Consistency in the GDP pace of China is the sign of a progressively stable economy. My Point of perspectives about dropping GDP rate of China centers from most recent few years on industrialization, China building up generation units in outside nations because of which the remote surplus is expanding step by step, innovative involvement, need improvement in the accessible pointer, need to build up new marker to bring the running system under GDP account. Changing nation financial aspects may likewise cause lower GDP rate. Chinese people are a very hard workers and devotees to their destiny, these people will come over the problem of this novel Coronas virus, and the whole world will be learned from them how to face difficulties with courage, unity, and hope of betterment.

| 1: GDP growth rate of China from 1961-2019 | |||
| Years | GDP growth (annual %) | Years | GDP growth (annual %) |
| Year 2020 | |||
| Model | Log Likelihood | AIC | ) |
| ARIMA(1,1,1) | -179.99 | 365.98 | ( B |
| ARIMA(1,1,2) | -180.52 | 369.03 | |
| ARIMA(1,0,2) | -175.62 | 361.24 | |
| ARIMA(2,0,2) | -173.74 | 355.48 | |
| ARIMA(2,1,2) | -172.1 | 354.19 | |
| ARMA(2,0,1) | -172.21 | 354.43 | |
| On the Basis of AIC ARMIA (2, 1, 2) is selected as the best fitted model for GDP data, Estimates of the Fitted (Best) | |||
| Model Using R software ARIMA (x = Data1, order = c (2, 1, 2) | |||
| Coefficients : | |||
| ar1 ar2 ma1 ma2 | |||
| 0.8429 -0.6593 -1.9832 0.9999 | |||
| s.e. 0.1398 0.1364 0.0826 0.0829 | |||
| Years | Forecast Value |
| 2020 | -0.3333646 |
| 2021 | -1.0785525 |
| 2022 | -0.8514384 |
| 2023 | -0.168686 |
| 2024 | 0.2570986 |
| 2025 | 0.1658679 |
| 2026 | -0.1917575 |