1. Introduction neven development between cities and villages in
Indonesia so far has given rise to the formal sector and the informal sector in economic activities. The movement of population from village to city has become a very prominent symptom in Indonesia which ultimately has various impacts on the region concerned, both positive and negative impacts that must be faced. Some of the activities of the population movement can be accommodated in the economic activities of the formal sector; on the other hand some of the residents who are not accommodated without the skills needed by a region have created a form of informal activities to sustain their lives. Some of those who are not accommodated in formal sector activities try to enter the informal sector activities, where this sector is very easy for anyone to enter without the skills indicated. The informal sector is mostly entered by the lower classes, namely those who are not accommodated in the formal sector and those who avoid the domination of the capitalists who have mastered the macro economy. Informal sector activities play a role in accommodating the workforce that is not accommodated in the formal sector. The sector enters the informal sector because there is no term contract employment long as in the formal sector so that the labor force mobility in the informal sector is high. This is one of the main factors that makes it easy for workers to enter this sector. Indonesia experienced the 1997 economic crisis which affected national and regional economic stability.
The efforts made by the Regional Government of Pulogadung District in East Jakarta in dealing with the problem of violation of order, comfort and tranquility of the city are with street vendor (PKL) control activities, namely the issuance of the Provincial Regulation of the Special Capital Region of Jakarta Number 8 of 2007 concerning Public Order. Have tried to suppress the violation of order that was carried out by the street vendors with these regulations but still there was still a violation of order. Order violations carried out by the Kender Market PKL include violations of selling hours, selling area violations, violations of building establishment, cleanliness violations and violations related to the aesthetics and neatness of the city.
Authority regarding the issue of Street Vendor Control (PKL) in East Jakarta Administrative City has been delegated to the DKI Jakarta Civil Service Police Unit (SATPOL PP), in accordance with Government Regulation Number 6 of 2010 concerning the Civil Service Police Unit, that the Civil Service Police Unit headed by a Head and domiciled under and responsible to the Regional Head through the Regional Secretary. The performance description of the SATPOL PP Unit in Pulogadung Sub-district, East Jakarta, can generally be seen from the activities of the SATPOL PP Unit which is serious in carrying out control activities against street vendors' acts. One example of a street vendor in East Jakarta City occupying public space as a place of business.
The focus of the performance discussion specifically in this regard is the work done by the SATPOL PP Unit in Pulogadung Sub-District, East Jakarta in its efforts to curb street vendors in the Klender Market who occupy public space as business land, pay more attention to control activities and minimize II.
2. Methods
This study is a quantitative study with an associative descriptive research approach, the purpose of descriptive research is to describe the object of research or research results while the purpose of associative research is to find out the relationship between two variables or more (Sugiyono, 2014). The population in this study was 38 SATPOL PP District Pulogadung.
The data collection method that will be used in this study is structured interviews using a personal questionnaire. Questionnaire is a technique of data collection conducted by giving a set of questions or written statements to the respondent to answer (Sugiyono, 2014: 162).
The statement presented in this questionnaire is a closed statement. Closed statements are made using an interval scale. The interval scale used in this study is the Likert scale, which is used to measure attitudes, opinions, and perceptions of a person or group of people about social phenomena (Sugiyono, 2004). The following is an overview of the score or score on the research questionnaire question.
3. b) Reliability Test
Reliability is an index that shows the extent to which a measuring device can be trusted or reliable (Ancok: 140-141). Reliability test is used to measure whether a respondent's answer is consistent or stable over time (Sugiyono, 2004). Instrument score assessment criteria in reliability coefficient or Cronbach Alpha test is 0.60 or more, then the indicators in the instrument are declared reliable (reliable).
4. Results and Discussion
5. a) Results of Descriptive Analysis of Research Variables
This research consisted of HR factors, facilities and infrastructure factors, communication, effectiveness, alertness (responsiveness), responsibility (responsibility), and sustainability (accountability). Explanation of the description of each variable using a frequency table obtained from the tabulation of respondents' answer scores. Based on the results of recapitulation of the frequency of the respondents' answers totaling 38 SATPOL PP regarding the field of work as SATPOL PP according to interest (SDM.1) it can be interpreted that the respondent gave a mean value of 4.29 which means very good. This indicates that the average field of work as SATPOL PP according to interest shows a positive meaning.
The recapitulation of the frequency of all respondents' answers totaling 38 SATPOL PP regarding the field of work as SATPOL PP made me more mature (SDM.2) can be interpreted that the respondent gave a mean value of 4.39 which means very good. This indicates that the average occupation as SATPOL PP makes me more mature showing positive meaning.
Recapitulation of the frequency of all respondents' answers totaling 38 SATPOL PP regarding understanding my work situation as the current SATPOL PP (SDM.3) can be interpreted that the respondent gave a mean value of 4.24 which means very good. This indicates that the average understanding of my work situation as SATPOL PP currently shows a positive meaning.
Recapitulation of the frequency of the overall answers of respondents totaling 38 SATPOL PP regarding the field of work as SATPOL PP can meet my needs (SDM.4) can be interpreted that the respondent gave a mean value of 4.39 which means very good. This indicates that the average field of work as SATPOL PP can meet my needs shows a positive meaning.
Recapitulation of the frequency of the overall answers of respondents totaling 38 SATPOL PP regarding the field of work as SATPOL PP according to my ability (SDM.5) can be interpreted that the respondent gave a mean value of 4.34 which means very good. This indicates that the average occupation as SATPOL PP is in accordance with my ability to show positive meaning.
Recapitulation of the frequency of the overall answers of respondents totaling 38 SATPOL PP regarding the field of work as SATPOL PP in accordance with my competence (SDM.6) can be interpreted that the respondent gave a mean value of 4.37 which means very good. This indicates that the average field of work as SATPOL PP in accordance with my competence shows a positive meaning.
Recapitulation of the frequency of the overall answers of respondents totaling 38 SATPOL PP regarding As SATPOL PP, I have sufficient knowledge related to work (SDM.7) can be interpreted that the respondent gave a mean value of 4.37 which means very good. This indicates that on average as SATPOL PP, I have sufficient knowledge regarding work to show positive meaning.
Recapitulation of the frequency of the overall answers of respondents totaling 38 SATPOL PP regarding As SATPOL PP, I can maintain emotions (SDM.8) can be interpreted that the respondent gave a mean value of 4.26 which means very good. This indicates that on average as SATPOL PP, I can keep emotions showing a positive meaning.
Recapitulation of the frequency of the overall answers of respondents totaling 38 SATPOL PP regarding As SATPOL PP, I can control mood (SDM.9) can be interpreted that the respondent gave a mean value of 4.37 which means very good. This indicates that on average, as a PP SATPOL, I can control my mood showing positive meanings.
Recapitulation of the frequency of the overall answers of respondents totaling 38 SATPOL PP regarding As SATPOL PP, I have confidence in doing the right (SDM.10) can be interpreted that the respondent gave a mean value of 4.21 which means very good. This indicates that on average as a PP SATPOL, I have confidence that doing the right thing shows positive meaning. Based on the results of the recapitulation of the frequency of all respondents' answers totaling 38 SATPOL PP regarding available facilities and infrastructure accelerate the process of implementing the work so that it can save time (SP.1) can be interpreted that the respondent gave a mean value of 4.37 which means very good. This indicates that the average facilities available speed up the process of carrying out work so that it saves time showing positive meaning.
The recapitulation of the frequency of all respondents' answers totaling 38 SATPOL PP regarding available facilities increases the productivity of both goods and services (SP.2). It can be interpreted that respondents gave a mean value of 4.39 which means very good. This indicates that the average means available to increase productivity both goods and services show a positive meaning.
The recapitulation of the frequency of all respondents' answers totaling 38 SATPOL PP regarding the available Facilities of work results that are more quality and guaranteed (SP.3) can be interpreted that the respondent gave a mean value of 4.21 which means very good. This indicates that the average facilities and infrastructures available are higher quality and guaranteed. They show a positive meaning.
The recapitulation of the frequency of all respondents' answers totaling 38 SATPOL PP regarding the available Facilities makes it easy to move SATPOL PP (SP.4) can mean that the respondent gave a mean value of 4.39 which means very good. This indicates that the average facilities available make it easier for SATPOL PP to show positive meaning.
The recapitulation of the frequency of all respondents' answers totaling 38 SATPOL PP regarding available Facilities further establishes the stability of workers (SP.5). It can be interpreted that the respondents gave a mean value of 4.39 which means very good. This indicates that on average the available facilities are more likely to establish workers' stability structure which shows positive meaning.
The recapitulation of the frequency of the total respondents' answers totaling 38 SATPOL PP regarding available facilities raises a sense of comfort for the SATPOL PP when using it (SP.6) can be interpreted that the respondent gave a mean value of 4.47 which means very good. This indicates that the average available facility creates a sense of comfort for the SATPOL PP when using it shows a positive meaning.
The recapitulation of the frequency of all respondents' answers totaling 38 SATPOL PP regarding the available Facilities raises satisfaction with SATPOL PP when using it (SDM.7) can be interpreted that the respondent gave a mean value of 4.37 which means very good. This indicates that the average available facilities give rise to satisfaction with SATPOL PP when using it shows a positive meaning. Recapitulation of the frequency of all respondents' answers totaling 38 SATPOL PP regarding Communication in the SATPOL PP environment in Pulogadung District there is the effectiveness of reciprocal communication (two way flow information) between the organization and the external (outside) organization (K.4) can be interpreted the mean value is 4.66 which means very good. This indicates that the average Communication in the SATPOL PP environment in Pulogadung District has the effectiveness of reciprocal communication (two way flow information) between the organization and the external environment (outside) the organization shows a positive meaning. Based on the results of the recapitulation of the frequency of the respondents' answers totaling 38 SATPOL PP regarding SATPOL PP Pulogadung Sub district providing information that can be accounted for (Akt.1) can be interpreted that the respondent gave a mean value of 4.50 which means very good. This indicates that the average SATPOL PP Kecamatan Pulogadung provides information that can be accounted for shows positive meaning.
6. iii. Description of Communication Factor Variables
7. iv. Description of Effectiveness Variables
Recapitulation of the frequency of all respondents' answers totaling 38 SATPOL PP regarding SATPOL PP Kecamatan Pulogadung produces output that can be justified (Akt.2) can be interpreted that the respondent gave a mean value of 4.47 which means very good. This indicates that the average SATPOL PP Pulogadung Sub-district produces results that can be accounted for shows a positive meaning.
Recapitulation of the frequency of all respondents' answers totaling 38 SATPOL PP regarding SATPOL PP Employees working in accordance with procedures and mechanisms (Akt.3) can be interpreted that the respondent gave a mean value of 4.37 which means very good. This indicates that the SATPOL PP Employee average works according to procedures and the mechanism shows a positive meaning.
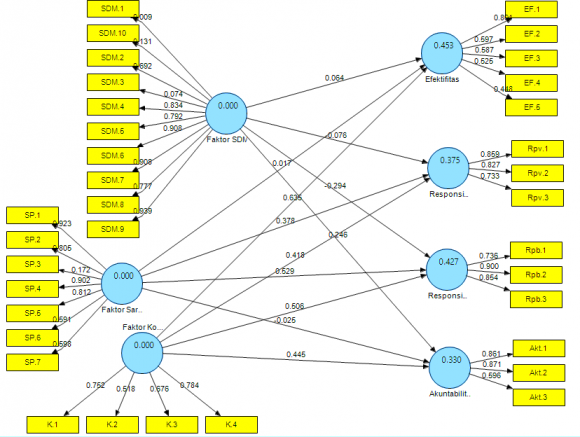
8. b) Overview of Structural Performance Models Through HR Factors, Means Factors and Communication Factors
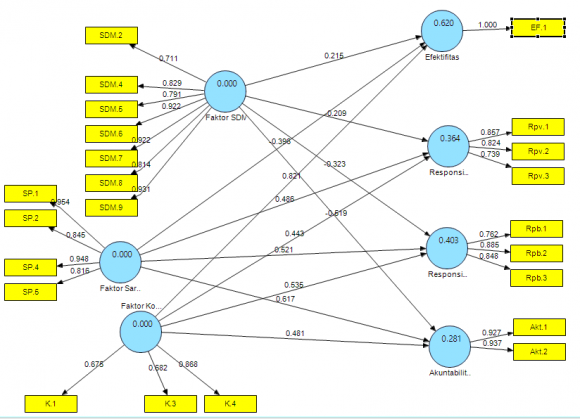
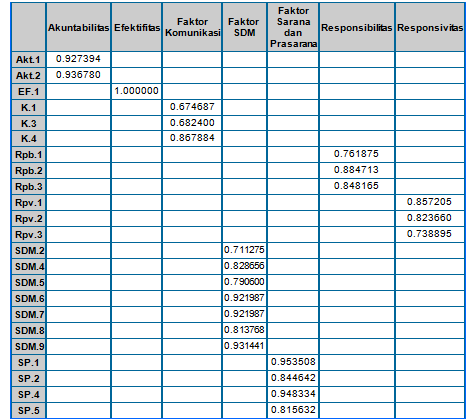
Based on the operational variables of this study, a research model was formed using PLS -Algorithm to test the feasibility of the model. To test the feasibility of the model using the outer model (measurement model) is the relationship between the indicator and the construct factor loading. In testing the validity of the model using values while testing reliability using the value of Composite Reliability (CR), Cronbach's Alpha (CA) and Average Variance Extracted (AVE). The table above shows the results of the Original Sample = 0.2141, T Statistics = 0.886. This shows that the influence between HR factors on effectiveness is not significant. Thus H1 in this study was rejected. This means that HR factors cannot increase effectiveness.
Hypothesis 2: HR factors have a negative and not significant effect on responsiveness (responsiveness).
The table above shows the results of the Original Sample = -0.20891, T Statistics = 0.711592. This shows that the influence between HR factors on alertness (responsiveness) is not significant. Thus H2 in this study was rejected. That means HR factors cannot increase alertness (responsiveness).
Hypothesis 3: HR factors have a negative and not significant effect on responsibility (responsibility).
The table above shows the results of the Original Sample = -0.32316, T Statistics = 1.148224. This shows that the influence between HR factors on responsibility (responsibility) is not significant. Thus H3 in this study was rejected. This means that HR factors cannot increase responsibility (responsibility). Hypothesis 4: HR factors have a negative and not significant effect on sustainability (accountability).
The table above shows the results of the Original Sample = -0.51936, T Statistics = 1.88685. This shows that the influence between HR factors on sustainability (accountability) is not significant. Thus H4 in this study was rejected. That means HR factors cannot improve sustainability (accountability).
Hypothesis 5: Facility factors have a negative and significant effect on effectiveness.
The table above shows the results of the Original Sample = -0.39639, T Statistics = 2.071555. This shows that the influence between the facilities and infrastructure factors on effectiveness is significant. Thus the H5 in this study is rejected. That is, when the factor increases, the effectiveness decreases. Hypothesis 6: Facility factors have a positive and not significant effect on alertness (responsiveness).
The table above shows the results of the Original Sample = 0.485713, T Statistics = 1.73965. This shows that the influence between the means of factors towards alertness (responsiveness) is significant. Thus H6 in this study was rejected. This means that when the factor increases, alertness (responsiveness) does not increase.
Hypothesis 7: Facility factors have a positive and significant effect on responsibility (responsibility).
The table above shows the results of the Original Sample = 0.521336, T Statistics = 1.93755. This shows that the influence between the facilities and infrastructure factors on responsibility (responsibility) is significant. Thus H7 in this study is accepted. That is, when the facilities and infrastructure factors increase, responsibility (responsibility) increases. Hypothesis 8: Facility factors have a positive and significant effect on sustainability (accountability).
The table above shows the results of the Original Sample = 0.616795, T Statistics = 2.326813. This shows that the influence between the factors of means towards sustainability (accountability) is significant. Thus the H8 in this study was accepted. This means that when facility factors increase, sustainability (accountability) increases. The table above shows the results of the Original Sample = 0.82083, T Statistics = 14.23992. This shows that the influence between communication factors on effectiveness is significant. Thus H9 in this study was accepted. This means that when communication factors increase, the effectiveness increases.
Hypothesis 10: Communication factors have a positive and significant effect on alertness (responsiveness).
The table above shows the results of the Original Sample = 0.442545, T Statistics = 4.599963. This shows that the influence between communication factors on alertness (responsiveness) is significant. Thus H10 in this study was accepted. This means that when communication factors increase, the responsiveness increases.
Hypothesis 11: Communication factors have a positive and significant effect on responsibility (responsibility).
The table above shows the results of the Original Sample = 0.5351, T Statistics = 5.764124. This shows that the influence between communication factors on alertness (responsiveness) is significant. Thus H11 in this study is accepted. That is, when communication factors increase, responsibility (responsibility) increases. The table above shows the results of the Original Sample 0.48097, T Statistics 5.064964. This shows that the influence between communication factors on alertness (responsiveness) is significant. Thus H12 in this study was accepted. This means that when communication factors increase, sustainability (accountability) increases.
9. IV.
10. Conclusion a) Conclusion
From a series of data management and analysis carried out in this study the conclusions can be drawn as follows:
| 1 | Strongly Agree | 4 |
| 2 | Agree | 3 |
| 3 | Disagree | 2 |
| 4 | Strongly Disagree | 1 |
| A quantitative study that uses data collection | ||
| techniques using questionnaires, it must do a validity | ||
| test. The test was tried on a sample of the population | ||
| taken, the members used were 38 respondents. Validity | ||
| test aims to determine whether the questionnaire used is | ||
| really valid to measure the variables under study. If the | ||
| Pearson correlations test results have an asterisk. | ||
| © 2019 Global Journals 1 |
| vi. Test the variable validity of responsibility |
| (responsibility) |
| No. | Item | Value | Description |
| 1 | HR Factor | 0.893 | Reliable |
| 2 | Factors of facilities and infrastructure | 0.846 | Reliable |
| 3 | Communication Factors | 0,656 | Reliable |
| 4 | Effectiveness | 0,646 | Reliable |
| 5 | Alertness (responsiveness) | 0,731 | Reliable |
| 6 | Responsibility (responsibility) | 0,777 | Reliable |
| © 2019 Global Journals |
| Source: Schafael, 2001 |
| Interpreting the average value of each indicator |
| in this research variable is intended to give an idea of |
| what indicators and variables I have built the overall |
| research model variable. The basis of the interpretation |
| of the average value used in this study refers to the |
| interpretation of the scores used by Schafael (2001). |
| of Frequencies / HR Factor | |||||||||
| Percentages (X1) | |||||||||
| Item | Respondents Answer Score | Mean | |||||||
| 1 | 2 | 3 | 4 | 5 | |||||
| F % F | % F | % | F | % | F | % | |||
| 1 | 0 0 | 0 | 0 0 | 0 | 27 | 71.1 | 11 | 28.9 | 4.29 |
| 2 | 0 0 | 0 | 0 0 | 0 | 23 | 60.5 | 15 | 39.5 | 4.39 |
| 3 | 0 0 | 0 | 0 0 | 0 | 29 | 76.3 | 9 | 23.7 | 4.24 |
| 4 | 0 0 | 0 | 0 0 | 0 | 23 | 60.5 | 15 | 39.5 | 4.39 |
| 5 | 0 0 | 0 | 0 2 5.3 | 21 | 55.3 | 15 | 39.5 | 4.34 | |
| 6 | 0 0 | 0 | 0 0 | 0 | 24 | 63.2 | 14 | 36.8 | 4.37 |
| 7 | 0 0 | 0 | 0 0 | 0 | 24 | 63.2 | 14 | 36.8 | 4.37 |
| 8 | 0 0 | 0 | 0 0 | 0 | 28 | 73.7 | 10 | 26.3 | 4.26 |
| 9 | 0 0 | 0 | 0 0 | 0 | 24 | 63.2 | 14 | 36.8 | 4.37 |
| 10 | 0 0 | 0 | 0 0 | 0 | 30 | 78.9 | 8 | 21.1 | 4.21 |
| Source: data processing, 2018 | |||||||||
| Year 2019 |
| Volume XIX Issue II Version I |
| ( ) |
| Global Journal of Management and Business Research |
| Item | Respondents Answer Score | Mean | |||||||
| 1 | 2 | 3 | 4 | 5 | |||||
| F % | F % | F | % | F | % | F | % | ||
| 1 | 0 0 | 0 0 | 0 | 0 | 24 | 63.2 | 14 | 36.8 | 4.37 |
| 2 | 0 0 | 0 0 | 1 2.6 | 21 | 55.3 | 16 | 42.1 | 4.39 | |
| 3 | 0 0 | 0 0 | 0 | 0 | 30 | 78.9 | 8 | 21.1 | 4.21 |
| 4 | 0 0 | 0 0 | 0 | 0 | 23 | 60.5 | 15 | 39.5 | 4.39 |
| 5 | 0 0 | 0 0 | 1 2.6 | 21 | 55.3 | 16 | 42.1 | 4.39 | |
| 6 | 0 0 | 0 0 | 0 | 0 | 20 | 52.6 | 18 | 47.4 | 4.47 |
| 7 | 0 0 | 0 0 | 0 | 0 | 24 | 63.2 | 14 | 36.8 | 4.37 |
| 8 | 0 0 | 0 0 | 0 | 0 | 24 | 63.2 | 14 | 36.8 | 4.37 |
| 9 | 0 0 | 0 0 | 1 2.6 | 21 | 55.3 | 16 | 42.1 | 4.39 | |
| 10 | 0 0 | 0 0 | 0 | 0 | 30 | 78.9 | 8 | 21.1 | 4.21 |
| Source: data processing, 2018 | |||||||||
| Item 1: Available tools speed up the process of carrying | |||||||||
| out work so that it saves time | |||||||||
| Item 2: Available facilities increase the productivity of | |||||||||
| both goods and services | |||||||||
| Item 3: The facilities available are more quality and | |||||||||
| guaranteed | |||||||||
| Item 4: Available facilities make it easier to move | |||||||||
| SATPOL PP | |||||||||
| Item | Respondents Answer Score | Mean | |||||||
| 1 | 2 | 3 | 4 | 5 | |||||
| F | % F % F | % | F | % | F | % | |||
| 1 | 0 | 0 0 0 | 0 | 0 | 25 | 65.8 | 13 | 34.2 | 4.34 |
| 2 | 0 | 0 0 0 | 2 | 5.3 | 21 | 55.3 | 15 | 39.5 | 4.34 |
| 3 | 0 | 0 0 0 | 0 | 0 | 24 | 63.2 | 14 | 36.8 | 4.37 |
| 4 | 0 | 0 0 0 | 0 | 0 | 13 | 34.2 | 25 | 65.8 | 4.66 |
| Source: data processing, 2018 | |||||||||
| Item 1: Communication in the SATPOL PP environment | |||||||||
| in Pulogadung District has the effectiveness of | |||||||||
| coordinating individual activities | |||||||||
| Item 2: Communication in the SATPOL PP environment | |||||||||
| in Pulogadung Sub district has effectiveness in overall | |||||||||
| organizational direction | |||||||||
| Item 3: Communication in the SATPOL PP environment | |||||||||
| in Pulogadung Sub district has information exchange | |||||||||
| effectiveness in the organization | |||||||||
| Distribution / Effectiveness Factor | ||||||||
| Percentage (Y1) | ||||||||
| Item | Respondents Answer Score | Mean | ||||||
| 1 | 2 | 3 | 4 | 5 | ||||
| F % | F % | F % | F | % | F | % | ||
| 1 | 0 0 | 0 0 | 0 0 | 13 | 34.2 | 25 | 65.8 | 4.66 |
| 2 | 0 0 | 0 0 | 0 0 | 25 | 65.8 | 13 | 34.2 | 4.34 |
| 3 | 0 0 | 0 0 | 0 0 | 22 | 57.9 | 16 | 42.1 | 4.42 |
| 4 | 0 0 | 0 0 | 0 0 | 27 | 71.1 | 11 | 28.9 | 4.29 |
| 5 | 0 0 | 0 0 | 0 0 | 23 | 60.5 | 15 | 39.5 | 4.39 |
| Source: data processing, 2018 | ||||||||
| v. Description of Variability Alert (responsiveness) | ||||||||
| Table 15: Distribution of Frequencies / Percentage of | ||||||||
| Awareness Factors (responsiveness) (Y2) | ||||||||
| Item | Respondents Answer Score | Mean | ||||||
| 1 | 2 | 3 | 4 | 5 | ||||
| F % | F % | F % | F | % | F | % | ||
| 1 | 0 0 | 0 0 | 0 0 | 22 | 57.9 | 16 | 42.1 | 4.42 |
| 2 | 0 0 | 0 0 | 0 0 | 13 | 34.2 | 25 | 65.8 | 4.66 |
| 3 | 0 0 | 0 0 | 0 0 | 19 | 50.0 | 19 | 50.0 | 4.50 |
| Source: data processing, 2018 | ||||||||
| Item 1: SATPOL PP Pulogadung District handles | ||||||||
| complaints | ||||||||
| Item 2: Complaints Handled Quickly | ||||||||
| Item 3: Availability of Complaint Facilities | ||||||||
| Based on the results of the frequency | ||||||||
| recapitulation of the respondents' answers totaling 38 | ||||||||
| SATPOL PP regarding SATPOL PP Pulogadung Sub | ||||||||
| district handling complaints (Rp. V.1) can be interpreted | ||||||||
| that respondents gave a mean value of 4.42 which | ||||||||
| means very good. This indicates that the average | ||||||||
| SATPOL PP Pulogadung District handles complaints of | ||||||||
| complaints shows a positive meaning. | ||||||||
| Recapitulation of the frequency of all | ||||||||
| respondents' answers totaling 38 SATPOL PP on | ||||||||
| Complaints Handling is done Quickly (Rp. 2). It can be | ||||||||
| interpreted that the respondent gave a mean value of | ||||||||
| 4.66 which means very good. This indicates that the | ||||||||
| average Complaints Handling is done Quickly showing | ||||||||
| a positive meaning. | ||||||||
| The recapitulation of the frequency of all | ||||||||
| respondents' answers totaling 38 SATPOL PP regarding | ||||||||
| the Availability of Complaint Facilities (Rpv.3) can be | ||||||||
| interpreted that the respondent gave a mean value of | ||||||||
| 4.50 which means very good. This indicates that the | ||||||||
| average Availability of Complaint Facilities shows a | ||||||||
| positive meaning. | ||||||||
| vi. Description of Variable Responsibility | ||||||||
| Responsibility Factors (responsibility) (Y3) | ||||||||
| Item | Respondents Answer Score | Mean | ||||||
| 1 | 2 | 3 | 4 | 5 | ||||
| F % | F % | F % | F | % | F | % | ||
| 1 | 0 0 | 0 0 | 0 0 | 20 | 52.6 | 18 | 47.4 | 4.47 |
| 2 | 0 0 | 0 0 | 0 0 | 20 | 52.6 | 18 | 47.4 | 4.47 |
| 3 | 0 0 | 0 0 | 0 0 | 13 | 34.2 | 25 | 65.8 | 4.66 |
| Source: data processing, 2018 | ||||||||
| Item 1: Organizational Structure of PP SATPOL supports | ||||||||
| SATPOL PP Performance | ||||||||
| Item 2: SATPOL PP which is formed according to its | ||||||||
| function | ||||||||
| Sustainability Factors (accountability) (Y4) | ||||||||
| Item | Respondents Answer Score | Mean | ||||||
| 1 | 2 | 3 | 4 | 5 | ||||
| F % | F % | F % | F | % | F | % | ||
| 1 | 0 0 | 0 0 | 0 0 | 19 | 50.0 | 19 | 50.0 | 4.50 |
| 2 | 0 0 | 0 0 | 0 0 | 20 | 52.6 | 18 | 47.4 | 4.47 |
| 3 | 0 0 | 0 0 | 0 0 | 24 | 63.2 | 14 | 36.8 | 4.37 |
| Source: data processing, 2018 | ||||||||
| Item 1: SATPOL PP Pulogadung District provides | ||||||||
| information that can be accounted for | ||||||||
| Item 2: SATPOL PP Pulogadung Sub-district produces | ||||||||
| output that can be accounted for | ||||||||
| Item 3: SATPOL PP employees work in accordance with | ||||||||
| procedures and mechanisms | ||||||||
| Year 2019 | |
| Volume XIX Issue II Version I | |
| ( ) | |
| ii. Reliability Test The next analysis of convergent validity is reliability construct by considering the value of Composite Reliability (CR), Cronbach's Alpha (CA) and Average Variance Extracted (AVE). It can be seen in the | Global Journal of Management and Business Research |
| following table: |
| AVE | Composite Reliability | R Square | Cronbach's Alpha | |
| Sustainability (accountability) | 0.868808 | 0.929798 | 0.280774 | 0.849162 |
| Effectiveness | 1.000000 | 1.000000 | 0.619778 | 1.000000 |
| Communication Factors | 0.558032 | 0.788748 | 0.631645 | |
| HR Factor | 0.721079 | 0.947225 | 0.934432 | |
| Means Factor | 0.796798 | 0.939799 | 0.921530 | |
| Responsibility (responsibility) | 0.694185 | 0.871528 | 0.403155 | 0.778440 |
| Alertness (responsiveness) | 0.653060 | 0.849070 | 0.363712 | 0.731992 |
| Source: SEM -PLS 3, 2018 | ||||
| Composite Reliability (CR) value for all | (AVE) are unreliable, namely the communication factor | |||
| constructs is> 0.7 which indicates that all constructs in | variable (0.631645). Research continues to be carried | |||
| the model are estimated to meet discriminant validity | out because when viewed from a statistical test that the | |||
| criteria. Thus the Composite Reliability (CR) test results | level of communication is very important. | |||
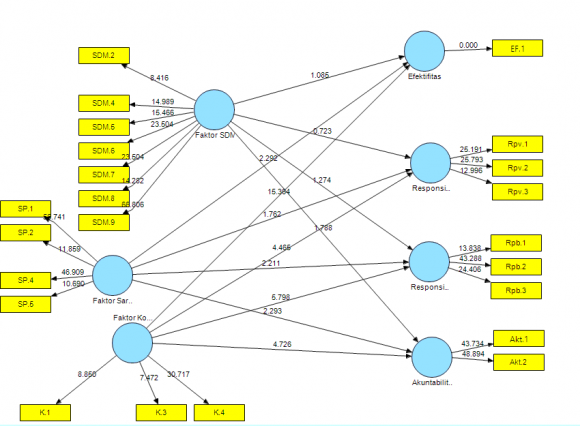
| show reliable. Meanwhile, the value of Cronbach's Alpha (CA) for all constructs is> 0.7. Thus the results of the Cronbach's Alpha (CA) test show reliable. The value of | d) Testing of Structural Models (Inner Model) i. Hypothesis testing | |||
| Average Variance Extracted (AVE) for all constructs is> | ||||
| 0.5. Thus the test results of Average Variance Extracted | ||||
| Original Sample (O) | Sample Mean (M) | Standard Deviation (STDEV) | Standard Error (STERR) | T Statistics (|O/STERR|) | |
| Communication Factors-> | |||||
| Sustainability | 0.48097 | 0.489504 | 0.09496 | 0.09496 | 5.064964 |
| (accountability) | |||||
| Communication Factors -> Effectiveness | 0.82083 | 0.824243 | 0.057643 | 0.057643 | 14.23992 |
| Communication Factors-> | |||||
| Responsibility | 0.5351 | 0.535679 | 0.092833 | 0.092833 | 5.764124 |
| (responsibility) | |||||
| Communication Factors -> Alertness (responsiveness) | 0.442545 | 0.447015 | 0.096206 | 0.096206 | 4.599963 |
| HR Factors -> Sustainability (accountability) | -0.51936 | -0.5665 | 0.275254 | 0.275254 | 1.88685 |
| HR Factor -> Effectiveness | 0.214605 | 0.223952 | 0.214694 | 0.214694 | 0.999587 |
| HR Factor -> Responsibility (responsibility) | -0.32316 | -0.3799 | 0.281443 | 0.281443 | 1.148224 |
| HR Factor -> Alertness (responsiveness) | -0.20891 | -0.25864 | 0.293577 | 0.293577 | 0.711592 |
| Facility Factors -> | |||||
| Sustainability | 0.616795 | 0.670981 | 0.265081 | 0.265081 | 2.326813 |
| (accountability) | |||||
| Means Factor -> Effectiveness | -0.39639 | -0.39277 | 0.191349 | 0.191349 | 2.071555 |
| Facility Factors -> | |||||
| Responsibility | 0.521336 | 0.587224 | 0.269069 | 0.269069 | 1.93755 |
| (responsibility) | |||||
| Means Factor -> Alertness (responsiveness) | 0.485713 | 0.543852 | 0.279201 | 0.279201 | 1.73965 |
| Source: SEM -PLS 3, 2018 | |||||