1. I. Introduction
inancial institution has been experienced substantial changes around the world in recent few years. As a financial institution, banking sector faces various challenges such as technology improvement, increased competition and market movement for these substantial changes. For this reason, bank efficiency has been an important issue to remain competitive in the financial market. In today's business world, increased competition in the financial market is putting pressure on banks to improve their earnings as well as control costs. Additionally, technological innovation, especially in the form of improvements in communication and data processing is creating opportunities for the bank and other financial institutions to raise productivity and to deliver various services through using electronic means. Thus, Bank needs to increase their efforts to balance between risk & efficiency and satisfy both shareholders and depositors through maximizing profit and ensuring capital return at any time respectively.
In the context of Bangladesh, the role of an increased banking system is crucial in fostering economic growth and development. During 2016, the number of scheduled commercial banks in Bangladesh is 46 which was 34 in 2011. Additionally, the total asset of banking systems such as Stated-owned Commercial Banks (SCBs), Private Commercial Banks (PCBs), Direct Financial Institutions (DFI) and Foreign Commercial Banks (FCBs) in Bangladesh is BDT 11626. 6 billion in 2016 which is increased by 12.72% from 2015 and 98.15% from 2011. The total deposits of the bank in 2016 is BDT 8933.9 billion which was BDT 7928.6 billion in 2015 and BDT 4509.7 billion in 2011. The expenditureincome (EI) ratio of the bank is 76.33% in 2016 which is almost same as 2015 but higher than 2011 when EI ratio was 68.49%. However, the profitability of the banks has decreased which means that Return on Assets (ROA) and Return on Equity (ROE) of the banks are 0.68% and 9.4% respectively in 2016 which were 0.8% and 10.5% respectively in 2015 and 1.5% and 17% respectively in 2011. Besides, the liquidity of the banks has also declined in 2016 which is 24.9% as compared to 26.5% in 2015 and 25.4% in 2011 (Source: Bangladesh Bank Annual Report). Therefore, cost ratio of the banking sector has increased along with a decline in profitability in recent years. But Profitability is necessary for a banking institution to run its ongoing activities and for shareholders to generate a fair return (Ponce, 2011). Although profit is the reward for successful risk-taking in business, excessive or poorly managed risk can lead to losses that must endanger the safety of a bank's deposit. Henceforth, Banks must emphasize benchmark performance efficiency to ensure their stability. On the other hand, the restraint in the synchronization of cash flows and the formation of liquidity is of great importance to ensure the improvement of efficiency (Pancheva, Prof. Dr. Aleksandrina, 2014).
Efficiency measurement is the benchmark of operational sufficiency and sustainability of a financial institution in the financial sector. It helps a bank to evaluate its performance with itself and other banks locally and internationally or in the different geographical and political regions (Ahmed and Liza, 2012). The study has used the financial ratio as it is a convenient and reliable tool to provide a great deal of information about a bank's financial performance especially at the time of comparing with prior periods and with other bank's performance (Oral andYolalan 1990 andHalkos andSalamouris 2004).
A few studies have done on bank's operational efficiency, liquidity, and profitability all over the world. But such studies are not made in Bangladesh, Thus it is needed to carry out. The objective of this study is to analyze the effect of liquidity and profitability on operating efficiency to provide an insight to the manger on risk management in the banking sector.
2. b) Operational Efficiency of Scheduled Commercial Banks of Bangladesh
The following graph 01 shows the present scenario of Operational Efficiency of Scheduled Commercial Banks of Bangladesh.
Graph 1: Operational Efficiency of Scheduled Commercial Banks of Bangladesh From the graph 01, it is revealing that the operational efficiency ratio of the SCBs is decreased from 1.18 in 2015 and 1.6 in 2011 to 1.11 in 2016 which could mainly be attributable to high administrative and operating expenses. In 2016, the operational efficiency ratio of PCBs is 1.33 which is increased slightly as compared to the previous year but decreased relative to 2011 ( In Appendix A, Table 2).
3. c) Profitability of Scheduled Commercial Banks of Bangladesh
The following two graphs show the profitability of scheduled commercial banks of Bangladesh by considering two indicators like return on assets (ROA) and return on equity (ROE) ratios respectively. 2).
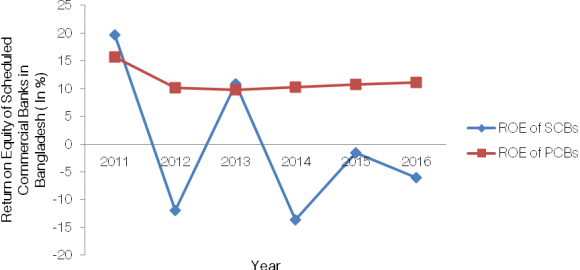
4. Graph 3: Return on Equity of Scheduled Commercial Banks of Bangladesh
From the graph 03, it is revealing that the ROE of SCBs stood at -6.02% in 2016, but it has deteriorated as compared to -1.47% in the last year. ROE of the PCBs increased to 11.09% in 2016 from 10.75% in 2015 (In Appendix A, Table 2).
5. d) Liquidity of Scheduled Commercial Banks of Bangladesh
The following graph 04 represents the present liquidity position of Scheduled Commercial Banks of Bangladesh.
Graph 4: Liquidity of Scheduled Commercial Banks of Bangladesh Graph 04 explains that liquidity ratio (Liquid Assets to Total Assets) of the PCBs in Bangladesh shows decreasing trend after 2014. On the other hand, SCBs liquidity ratio shows steady trend from 2013 to 2016 (In Appendix A, Table 2).
6. III. Literature Review
Bank's operational efficiency, liquidity, and profitability explore its real position. For that reasons, such factors have drawn the considerable attention of the researchers worldwide. Empirical studies, however, reveal a mixed result.
Eliza (2007) stated that an efficient scientificpractical approach is required to balance the organizational inputs and outputs, and with continuously functional evaluation, institutionalize the quality and efficiency. In this regard, Shawk (2008) outlines that operational efficiency is the ability to produce services and products with cost-effectively without sacrificing quality. He explains that operational efficiency occurs when the right combination of people, process, and technology come together to improve the productivity and value of any business operation while driving down the cost to a minimum level. Radic et al. (2011) analyzed cost and profit efficiency of investment banks in G7 countries and Switzerland and found that increased bank risks such as liquidity and capital risks underestimate bank's efficiency. Moreover, Brissimis et al. (2008) reveal that capital and credit risk has a negative impact on bank efficiency when high liquidity reduces bank performance.
Liquidity of a bank acts as the blood of human body that enables a bank to maintain its operational activities and to survive in the competitive market. Odunga et al. (2013) reveal that a positive relationship exists between liquidity, capital, and operational efficiency. They explained that bank should give importance to such activities that improve their liquidity and capital ratios to enhance operational efficiency. According to Muya and Gathogo (2016), profitability implies the efficiency of the management in transforming the firm's resources to profits. Tariq et al. (2014) stated that profitability becomes a key factor for running the business smoothly and has a significant effect on both performance of the bank and economic development in today's competitive world. Usually, profitable firms are more efficient because of having their lower costs. Berger (1995) reveals that highly efficient firm can maximize profit relative to its competitors by maintaining its current size and pricing strategy or by reducing prices and expanding its operations. Additionally, Hussein and Ahmad (2007) reveal that efficiency levels are different among the various branches of the bank. They suggest that bank can reduce employee's expenses and other operating expenses along with an increase in the total loan portfolio by giving focus on operational improvement efforts. They also explained that interest and non-interest revenues are required to increase to improve profitability efficiency of the whole branch network. In this case, Mensi and Zouari (2010) explain that banks that operate efficiently increase their profit from their competitors.
In line with the above literature reviews, the research is made to focus more attention on the impact of liquidity and profitability on sample commercial banks in Bangladesh.
7. IV. Methodology a) Sample Design
The sample captures annual observations of 30 scheduled commercial banks, comprises of 3 Stateowned Commercial Banks and 27 Private Commercial Banks of Bangladesh (Appendix A, Table 3) over the period from 2011 to 2016. During 2011, the total scheduled commercial banks in Bangladesh were 34. Thus, the study tries to cover most of the scheduled commercial banks in Bangladesh that have available data for at least six years.
8. b) Data Collection
In the study, secondary data of the selected scheduled commercial banks in Bangladesh are used to conduct the research. Such data collect from annual reports and web sites of the respective banks.
Additionally, various articles have been reviewed to select related variables which influence the operational efficiency of commercial banks.
9. c) Variables Measurement i. Dependent Variable
In the study, the dependent variable is the operational efficiency of commercial banks which is measured in different ways in various research papers. Some authors calculate Operational Efficiency Ratio (OER) by dividing operational expense by interest and non-interest income where a decrease in the OER is desirable means that bank is generating more earnings than its spendings (Allen and Rai 1996; Yeh 1996; Halkos and Salamouris 2004). On the other hand, several types of research have used the reciprocal of the ratio (Amer 2011; Odunga 2016). The study follows the latter formula where a higher OER is desirable as it reflects the pricing and production efficiency of the bank (Table 4).
10. ii. Independent Variables
The explanatory variables in the study are bank's financial performance indicators which are considered under Bank Size, Liquidity and Profitability of the selected commercial banks as follows:
11. ii. Driscoll and Kraay (1998) Standard Errors (DKSEs)
Driscoll and Kraay (1998) Standard Errors (DKSEs) is a nonparametric technique used to estimate standard error where the residual of the model is assumed to be heteroskedastic, auto-correlated up to some lag and possibly correlated the groups (panels). This technique provides robust standard error to the model having heteroskedasticity problem with crosssectional and temporal dependence (Driscoll and Kraay 1998).
12. iii. Feasible Generalized Least Square (FGLS) Model
Feasible Generalized Least Square (FGLS) model assumes that the regression errors of the model suffer from autocorrelation and heteroskedasticity problem. This model can correct panel heteroskedasticity and also consider autocorrelation and contemporaneous correlation (Beck and Katz, 1995).
13. iv. Panel Correlated Standard Error (PCSE) Model
Panel Correlated Standard Error (PCSE) Model is the modification procedure of Feasible Generalized Least Square which is robust against cross-sectional heteroskedasticity and autocorrelation (Beck and Katz, 1995).
14. v. Discussion of Findings a) Descriptive Analysis
The following Table 5 shows the descriptive statistics of the selected variables of scheduled commercial banks in Bangladesh.
15. Author's Contribution
Table 5 shows that the average result of OE is 1.124058 with a minimum ratio of 0.71432 and a maximum ratio of 1.767872 which explains that the selected commercial banks are in good position to cover its all operating expenses from its revenue and still able to make earnings for its shareholders. The average rate of IBR and LADS ratios are 164.28% and 17.42% respectively which explain that the selected commercial banks maintain proper liquidity to return capital to its depositors at any time. Additionally, the average rate of LR and NLTDB ratios are 64.60% and 83.92% respectively which indicate that the selected banks can collect funds from its depositors and transform the funds into investment to earn a profit. Further, Table 5 depicts that the average return of ROA is 1.11% with a minimum ratio of -4.9% and a maximum ratio of 7% which explains that the management efficiency has low trend during the study period. Again, the ROE is 10.50% on average which means that the selected commercial banks can earn more than the prevailed market rates for their owners during the study period. Pair-wise correlation coefficients are measured to find out the relationship between the selected variables (Table 6). The correlation result shows that net loans to total deposits and borrowings, other operating income to average assets, return on assets and return on equity ratios have the positive and significant correlation with operational efficiency. On the other hand, a log of total assets, interbank ratio, liquid assets to total deposits and short-term funding, net loans to total deposits and borrowings, net interest margin and recurring earning power ratios have the insignificant relationship with operational efficiency of the selected commercial banks.
16. Test of Multicollinearity
In the study, Variance Inflation Factor analysis (VIF) is performed to find out the correlation between explanatory variables and exclude the variables having correlation ? 0.80 (Kennedy 2003) and VIF > 5 (Amer et al 2011). The result shows that there is no multicollinearity among the selected variables as correlation < 0.80 (Table 6) and VIF < 5 as follows (Table 7):
(9) = (b-B)'[(V_b-V_B)^(-1)](b-B) = 45.2 Prob>chi2 = 0.000017. Author's Contribution
To examine the standard OLS assumptions for panel data in the study, three post-estimation tests are performed for cross-sectional independence, autocorrelation, and heteroskedasticity as follows:
18. Author's Calculations
The study observes from Table 9 that the residual errors suffer from cross-sectional independence, autocorrelated, and heteroskedastic problems, as the probability of all tests is less than 0.05.
19. f) Empirical Models and Results
The study performs five models for panel date analysis to get robust results, influence the operational efficiency of the selected commercial banks where Model Table 10 reveals that the fixed effect regression model explains 66.23% and PCSEs explains 98.85% of variations in operational efficiency of the selected commercial banks in Bangladesh. Further, NLTDB, ROE, and REP are positively significant under all models, and LR and LADS are negatively significant under Model 1, 2, 4, 5 and Model 1,3,4,5 respectively. Moreover, ROA is positively significant under model 1, 4, 5. On the other hand, LTA, IBR, NIM, and OOPIAA ratios are insignificant with OE. In the study, some independent variables are significant in explaining variations in operational efficiency of the selected commercial banks which are discussed below under various heads:
20. i. Liquidity and Operational Efficiency
Table 10 shows a negative relationship between LR and OE which explains that bank has less liquidity risk as high LR causes liquidity risk for banks (Soedarto, M. 2004). Again, Net loans to Total Deposits and Borrowings (NLTDB) ratio as a liquidity ratio explains that bank's ability to collect funds as deposits and borrowings and distribute it to third parties in the form of credit. Table 10 shows that there is a relationship between NLTDB and OE which indicates that providing loans from deposits and borrowings increases bank's operational efficiency that is supported by Mishin and Eakins (2012) explain that conversion of deposits into loans can improve efficiency in transforming assets into liabilities. Another significant liquidity ratio is liquid assets to total deposits and shortterm funding which shows negative correlation with operational efficiency, implies that bank's income generating capacity decreases with increase in the liquid assets. In this regard, Kwan (2002) stated that increased liquidity position of the bank becomes more costly as it includes additional transportation cost, storage and protection cost and labor cost. Thus the three significant ratios suggest that bank's liquidity should be controlled and managed without ignoring bank's investment opportunities. ii. Profitability and Operational Efficiency Table 10 highlights that as profitability ROE, ROA, and REP ratios have positive relation with operational efficiency. The positive relationship between ROE and operational efficiency implies that banks focus on generating more profit to satisfy their shareholders. Other significant profitability ratios with OE in the study are ROA and REP that explain that commercial banks should invest in resources to increase their earnings that would boost their operational efficiency. In this case, Das and Ghosh (2006) stated that Banks with higher profitability attract customers, increase deposits and lendings and are efficient in intermediation activities.
21. iii. Proposed Model
A model is proposed to identify the influence of liquidity and profitability on the operational efficiency of commercial banks by the findings in the study. The model will assist bank managers to analyze and take necessary steps to minimize bank's risk exposure to improve the operational efficiency of commercial banks. Of the variables which are considered significant and consistent under three empirical models to the minimum in this study have been established as accepted model. The proposed model is as follows in Table 11:
22. Author's Contribution
Table 11 reveals that banks should give attention to LR, NLTDB, and LADS ratios under liquidity and ROE, ROA, and REP ratios under profitability to ensure operational efficiency. The study explains that after maintaining the minimum requirement of liquid assets, the bank should use their customer's deposits and borrowings for investment and lending purposes to increase their operational efficiency and earnings.
23. Commercial
banks' contribution toward fostering economic growth and development is of great importance in the competitive business world. As increased banks and non-bank financial institutions raise stiff competition in Bangladesh, Bank's operational efficiency with liquidity and profitability is getting emphasized. The study focuses more attention on operational efficiency and some crucial factors like liquidity and profitability of selected scheduled commercial banks of Bangladesh to ensure the stability of banking system in the competitive market.
The analysis of the study implies that the efficient commercial banks exist in Bangladesh as the average operational efficiency of the selected commercial banks is 1.124058 with standard deviation is 0.086385. The empirical results of the study indicate that liquidity and profitability combined explain about 66.23% and 98.85% of the bank's operating efficiency under Fixed Effect Regression Model and Panel Correlated Standard Error Model respectively. From the study, it is revealed that bank's operational efficiency is not affected by bank size, especially in term of its assets.
Moreover, the study explains that after maintaining minimum liquidity, banks are motivated to follow highquality lending policy and ensure proper utilization of their customer's deposits and borrowings through making high-quality loan portfolio to ensure earnings for their shareholders.
Here, the study gives importance to liquidity and profitability to determine operational efficiency of commercial banks. Hence, an integrated model can be developed in the further research which will show a complete picture of bank's operational efficiency by considering many other factors like capital adequacy, credit risk, asset quality, GDP, inflation rate, board of director's composition, auditor's role, skill and qualification of employee, value of collateral.
24. Year 2018 ( )
A
| II. Present Scenario of Operational |
| Efficiency, Liquidity, and |
| Profitability of Scheduled |
| Commercial Banks in Bangladesh |
| a) Structure of Banking System of Scheduled |
| Commercial Banks of Bangladesh |
| The following table shows the structure of |
| banking system of scheduled commercial banks of |
| Bangladesh. |
| Dependent Variable | Performance Measure (Ratio) | Formula | |
| [Interest Income + Non-interest Income | |||
| Operational Efficiency | Operational Efficiency Ratio (OER) | +Securities Gains (Losses)] / [Interest Expenses + Non-interest Expenses+ | |
| Provision for Loan Loss + Taxes] | |||
| Independent Variables | Performance Measure (Ratio) | Formula | |
| Bank Size | LTA | Log Total Assets | Natural Log of Total Assets |
| IBR | Interbank Ratio | Money Due to Other Banks / Money Due from other Banks | |
| Liquidity | LR NLTDB | Loans Ratio Net Loans to Total Deposits and Borrowings Net Loans / Total Deposits and Borrowings Net Loans / Total Assets | |
| LADS | Liquid Assets to Deposits and Short-Term Funding | Liquid Assets / Deposits and Short-Term Funding | |
| NIM | Net Interest Margin | Net Interest Income / Earning Assets | |
| OOPIAA | Other Operating Income to Average Assets | Other Operating Income / Average Assets | |
| Profitability | ROA | Return on Assets | Net Income after Tax / Total Assets |
| ROE | Return on Equity | Net Income after Tax / Shareholders Funds | |
| REP | Recurring Earning Power | Pre-Provision Income / Average Total Assets | |
| Authors' Contribution | |||
| d) Mode of Data Analysis | |||
| The study follows panel data approach where it | |||
| runs initially descriptive statistics, correlation matrix and | |||
| test of multicollinearity. | |||
| Descriptive Statistics | |||||
| Variable | Obs | Mean | Std. Dev. | Min | Max |
| OE | 180 | 1.124058 | 0.086385 | 0.71432 | 1.767872 |
| LTA | 180 | 25.95143 | 0.516428 | 24.93716 | 27.42935 |
| IBR | 180 | 16.42795 | 117.6427 | 0 | 1568.532 |
| LR | 180 | 0.645991 | 0.099874 | 0.064276 | 1 |
| NLTDB | 180 | 0.839246 | 0.323073 | 0.533367 | 3.157008 |
| LADS | 180 | 0.174264 | 0.125417 | -0.00563 | 1.055367 |
| NIM | 180 | 0.031138 | 0.028071 | -0.00786 | 0.186033 |
| OOPIAA | 180 | 0.003605 | 0.002454 | 0.000386 | 0.015342 |
| ROA | 180 | 0.011106 | 0.009217 | -0.0492 | 0.07 |
| ROE | 180 | 0.105025 | 0.215057 | -2.5994 | 0.3009 |
| REP | 180 | 0.035792 | 0.011404 | -0.00544 | 0.101087 |
| Correlation Analysis |
| Year 2018 | ||
| ( ) | ||
| Multicollinearity Test | ||
| Variable | VIF | 1/VIF |
| LADS | 3.17 | 0.315308 |
| NLTDB | 2.75 | 0.363366 |
| ROA | 2.15 | 0.465649 |
| ROE | 1.86 | 0.538125 |
| OOPIAA | 1.53 | 0.654211 |
| LR | 1.49 | 0.670447 |
| NIM | 1.44 | 0.696197 |
| LTA | 1.31 | 0.762308 |
| REP | 1.12 | 0.894442 |
| IBR | 1.02 | 0.983231 |
| Mean VIF | 1.78 | |
| Author's Calculations | ||
| d) Hausman Test | ||
| Hausman Test | ||||
| ----Coefficients ---- | ||||
| (b) | (B) | (b-B) | Sqrt (diag(V_b-V_B)) | |
| Fixed | Random | Difference | S.E. | |
| LTA | -0.021062 | -0.0042097 | -0.0168523 | 0.0159277 |
| IBR | -5.70E-06 | 0.0000145 | -0.0000202 | 0.0000133 |
| LR | -0.1289669 | -0.1396878 | 0.0107208 | 0.0424937 |
| NLTDB | 0.1934325 | 0.1525369 | 0.0408956 | 0.0380148 |
| LADS | -0.299755 | -0.2956323 | -0.0041228 | 0.0570025 |
| NIM | 0.3858974 | -0.3264674 | 0.7123648 | 0.6327847 |
| OOPIAA | 3.811555 | 3.388882 | 0.4226739 | 2.640311 |
| ROA | 3.053595 | 3.200051 | -0.1464554 | 0.3621714 |
| ROE | 0.161948 | 0.1221126 | 0.0398354 | 0.0109378 |
| REP | 2.354385 | 2.441394 | -0.0870092 | 0.4251907 |
| b = consistent under Ho and Ha; obtained from xtreg | ||||
| B = inconsistent under Ha, efficient under Ho; obtained from xtreg | ||||
| Test: Ho: difference in coefficients not systematic | ||||
| chi2 | ||||
| Cross-sectional Independence Test (Pesaran's Test) | Autocorrelation Test (Wooldridge Test in Panel Data) | Group wise Heteroskedasticity Test (Modified Wald Test in Fixed Effect Regression Model) |
| Pesaran's test of cross-sectional independence = 3.239 | H0: no first-order autocorrelation | H0: sigma(i)^2 = sigma^2 for all i |
| Average absolute value of the off-diagonal elements = 0.411 | F( 1, 29) = 13.016 | chi2 (30) = 6537.92 |
| Probability (Pr) = 0.0012 | Prob > F = 0.0011 | Prob>chi2 = 0.0000 |
| Year 2018 | |
| e) Test of cross -sectional independence, autocorrelation, and heteroskedasticity | Volume XVIII Issue VII Version I |
| ( ) A | |
| Global Journal of Management and Business Research |
| Variable | Empirical Models | ||||
| OE | FE | CRSEs | DKSEs | FGLS | PCSE |
| LTA | -0.021062 (0.018433) | -0.021062 (0.015622) | -0.021062 (0.013045) | -0.00335 (0.028393) | -0.0079982 (0.0122225) |
| IBR | -5.70E-06 (3.82E-05) | -5.70E-06 (5.83E-06) | -5.70E-06 (7.53E-06) | -3.43E-06 (1.55E-05) | -2.88E-06 (0.0000168) |
| LR | -0.1289669 (0.066502*) | -0.1289669 (0.067684*) | -0.1289669 (0.088761) | -0.31392 (0.158217**) | -0.1110156 (0.0457661**) |
| NLTDB | 0.1934325 (0.043664***) | 0.1934325 (0.022429***) | 0.1934325 (0.080408*) | 0.189179 (0.041823***) | 0.1656169 (0.0378706***) |
| LADS | -0.299755 (0.082328***) | -0.299755 (0.214478) | -0.299755 (0.134459*) | -0.4721 (0.130403***) | -0.3437596 (0.0976793***) |
| NIM | 0.3858974 (0.657508) | 0.3858974 (1.009182) | 0.3858974 (0.502886) | 1.63185 (1.053695) | -0.3758223 (0.1582313) |
| OOPIAA | 3.811555 (3.378186) | 3.811555 (3.620924) | 3.811555 (1.920971) | -0.94322 (6.755855) | 4.401648 (2.830049) |
| ROA | 3.053595 (0.757335***) | 3.053595 (2.69356) | 3.053595 (2.409975) | 2.018998 (1.062023*) | 2.804988 (1.012655***) |
| ROE | 0.161948 (0.028684***) | 0.161948 (0.073333**) | 0.161948 (0.067806*) | 0.193889 (0.039004***) | 0.1590961 (0.0426204***) |
| REP | 2.354385 (0.575528***) | 2.354385 (1.159173*) | 2.354385 (0.704727**) | 1.209938 (0.726113*) | 2.69821 (0.5428807***) |
| _cons | 1.483004 (0.504338***) | 1.483004 (0.43849***) | 1.483004 (0.369744) | 1.232063 (0.81337) | 1.176417 (0.3309579***) |
| F Value | F(10, 140) = 27.46*** | F(10, 29) = 673.27*** | F( 10, 5) = 110.93*** | ||
| Maximum lag | 2 | ||||
| Wald chi2 (10) | 239.95*** | 199.98*** | |||
| R-squared | 0.6623 | 0.6623 | 0.6623 | 0.9885 | |
| Note: Number of Observations=180, Number of Groups=30, Time Periods=6, Observations per Group = 6. | |||||
| Under FGLS and PCSE: | |||||
| Estimated covariances = 465, Estimated autocorrelations = 30, Estimated coefficients = 11, Panels: | |||||
| heteroskedastic with cross-sectional correlation, Correlation: panel-specific AR (1). | |||||
| Significance: * = p < 0.10, **= p < 0.05, *** = p < 0.01. | |||||
| Bank's Financial Indicators | Variables (Significant ? Three Empirical Models) | Name of the Model |
| LR | FE + CRSEs + FGLS + PCSE | |
| Liquidity | NLTDB | FE + CRSEs + DKSEs + FGLS + PCSE |
| LADS | FE + DKSEs + FGLS + PCSE | |
| ROA | FE FGLS + PCSE | |
| Profitability | ROE | FE + CRSEs + DKSEs + FGLS + PCSE |
| REP | FE + CRSEs + DKSEs + FGLS + PCSE |