1. Introduction
aking sound investment decisions in the equity market is a daunting task. Any rational investor wants to maximize return while minimizing risk of the investment he or she holds (Sarker, Optimal Portfolio Construction: Evidence from Dhaka Stock Exchange in Bangladesh, 2013). But selecting a set of investments which will help achieve this objective from a large set of available assets is a task of thorough analysis. Constructing an optimal portfolio that maximizes the return per unit of minimum risk can be done applying the theoretical model proposed by Harry Markowitz. This model optimizes the desired scenario by giving the analyst as output the individual weights that need to be given into the selected asset classes. This model is applied in this study on a selected set of stocks from Dhaka Stock Exchange.
According to Markowitz Portfolio Theory, an investor can reduce the amount of risk he or she is exposed to by holding combinations of assets where the assets are not perfectly positively co-related (Iyiola Omisore, 2012). Holding these combinations can make it possible for the investor to gain same level of return with reduced level of risk. Portfolio construction, in theory, is a very efficient way of maximizing return with reduced risk level. Although there have been many studies on the application of this theory in the developed markets, quite a few studies have been done on its application in the frontier markets. This study focuses on the applicability of this theory in a specific segment of the Dhaka Stock Exchange (DSE), DS30, which is an index made of high market capitalization stocks. This study tends to construct a portfolio which is optimized given the selected investment set. This application of the stated theory will help Bangladeshi retail and institutional investors realize the need and impact of portfolio construction in the equity market and thus make them understand the importance of passive portfolio construction.
2. II.
3. Literature Review
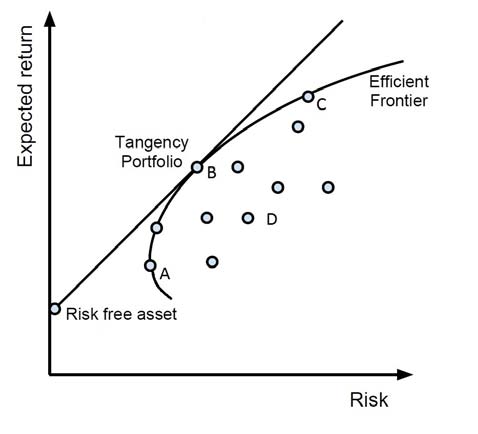
Modern Portfolio Theory or MPT is a theory of investment attempting to maximize the return for any given level of risk. According to Markowitz, the portfolio selection is a two-step process: first step is observing and believing future performance of given stocks and the second step is selecting a combination of securities based on that belief of future performance (Markowitz, 1952). According to MPT, it is possible to construct an efficient frontier which offers maximum return for a given level of risk. In this combination of assets, it is not enough to look at the individual returns and risks only; the interplay or co-movement of the considered assets play a major role in quantifying the portfolio risk. This is a simplified model which have some assumptions made for the MPT to hold: According to this theory we can find an optimal or tangency portfolio on the efficient frontier where an investor can receive the highest reward to risk ratio possible. This diversification concept through optimization hold true for the Zimbabwean equity market where the incorporation of skewness has shown better fit to the optimization model (Petros).
There are researches done on the performance of portfolios of assets in the form of mutual fund. In Bangladesh, Mutual funds ensure higher returns than the market. The popular choices made by fund managers are high beta stocks which are currently undervalued (Das, 2016).
For 2007-2012 period a study was done on optimal portfolio construction where stocks from DSE were selected. The optimal return possible from this sample contained 33 stocks, offering an optimal return of 6.17% with a risk of 8.76% (Sarker, Markowitz Portfolio Model: Evidence from Dhaka Stock Exchange in Bangladesh, 2013). Another study suggests that although diversification of assets is achieved in the pharmaceutical industry of Bangladesh, it is done by sacrificing returns, which is poorer than the market return. (Chowdhury, 2015). To get the maximum return possible, optimization is needed combining stocks from outside this industry as well. The application of MPT in the real estate market of Malaysia has also been studied. The application of MPT has caused a shift from 'tactical and operational' to 'strategic and tactical' style of management in the real estate sector (Hishamuddin Mohd Ali). The increasing number of REITs in Bursa Malaysia can be further analyzed from behavioral perspective using advanced modules of MPT.
Further work on the MPT in the later stages has been done. It is established that avoiding the pursuit of alpha and maintain a globally indexed savings portfolio can lead to healthy returns by taking lower risk (Roche, 2016).
III.4. Research Methodology a) Research Purpose
The purpose of this study is to apply the modern portfolio theory to construct an optimal portfolio of assets from the equity market so that retail investors, primarily, can easily replicate such a portfolio with the assigned weights and gain the maximized return from the constructed portfolio.
5. b) Objective of the Study
The broad objective of the study is to optimize the portfolio made of 12 selected stocks from DS30 index. Specifically, this study aims to: 1. Find out the portfolio return in an equally weighted scenario 2. Find out the weights to be given to the stocks in order to perform portfolio optimization 3. Maximize Sharpe Ratio restricting the short-sale of stocks c) Methodology
The study starts with a judgmental sampling method where 12 stocks from a population of 30 is selected from DS30 index. The monthly returns are calculated as per below formula where It = month end price of the security and It-1 = previous month end price of the security:
After the monthly return data is calculated, portfolios in two different scenarios are designed: the first one with equal weight in all the 12 selected assets and the later with optimized weights in selected securities to ensure maximum return and minimum risk. The formula used for portfolio return is: w represents the weights of each asset, and r represents the returns on the assets. Risk of the constructed portfolio is measured using the below stated equation:
Where ?ij is the correlation coefficient between the returns on assets i and j.
Finally, the maximum return per unit of risk attainable through portfolio optimization is calculated as peer the stated equation:
R t = [I t / I t-1 ] -1 R p = ? w i r i where w i = 1 ? p 2 = ?w i 2 ? i 2 + ?? w i w j ? i ? j ? ijThe optimized portfolio's Sharpe ratio is the maximum given the set of 12 selected stocks.
6. d) Data Collection
The 12 stocks were picked according to judgmental sampling in order to ensure that all the industries are represented in the investment opportunity set: The selected stocks are from DS30 index. DS30 is constructed with 30 leading companies which are considered investable companies. This index reflects about 51% of the total equity market capitalization. These stocks on DS30 have a floated market capitalization of more than BDT500 million.
The study is conducted using secondary data from DSE. Data from LankaBangla Stock portal is also collected.
7. e) Rationale
Bangladesh, as a frontier market has huge potential to grow its economy. The reflection of the economic prosperity ultimately be in the stock market which is yet to be a mature one. There have been numerous studies on the equity market in Bangladesh. Also, there have been studies on the investor behavior and stock market efficiency of this country. But there lies a gap on the studies regarding portfolio optimization given an investment opportunity set. For a country such as Bangladesh where the majority of the retail investors are yet to be educated investors, an optimization of a portfolio of blue chip stocks is necessary. Holding this portfolio for a long term in the assigned stock weights may lead to higher returns than that achieved in the current scenario.
8. f) Structure of the Article
The paper starts with the literature review in this field both in national and international context. Next, the objectives and the methodology of the study are elaborated. After enlisting the data collection method, findings of the study are focused on. Both the portfolio cases are explained with the Sharpe Ratio. In the conclusion part, the results implication of this research is explained with focus on further scopes of study.
9. g) Limitations of the Study
In calculating the return and risk of the assets the study uses historical rates of return. It is an assumption that the stock prices will come back to such prices in the future so that the historical rates are realized in the coming periods. For this to happen, it is to be assumed that historical prices are a better predictor of future price movements. This assumption may not hold true. It might be the case that in the future a company might not give the return that it has in the past 5 years on an average. Also, the results might change when companies from the rest 18 in the population are considered.
IV.
10. Analysis and Findings
Monthly price data, after adjusting for stock & cash dividend, stock split and right share, is used to calculate the monthly returns for the 12 companies. The monthly price is for the period of 2012-2017.
11. Table 2: Monthly Excess Return
Using these monthly returns the excess returns are calculated where monthly return on 30-day T-bill of Bangladesh bank is used as the risk-free rate. In the equal weight scenario, all the assets were given 8% weight. The portfolio monthly excess return in this case is 0.36% which leads to an annual excess return of 4.35%. In order to calculate portfolio variance, the study performs a co-variance matrix utilizing all the asset returns. The matrix using monthly returns is below: The resultant portfolio standard deviation is 6.44% (monthly) leading to an annual standard deviation of 22.32%. Annual Sharpe ratio for the equal weight scenario is 0.19.
In the second scenario, where the study targets to maximize the Sharpe ratio, the same formula are used.
But in this case, the objective is to find out the weights that has to be put to individual securities in order to maximize the Sharpe ratio given the investment opportunity set of 12 stocks. According to the optimization function, the weights that need to be assigned to the securities are: As it can be seen from the above analysis, even though on stand-alone basis few stocks had negative excess returns, when combined as a portfolio, the return turns positive. In the optimized portfolio, not only the return increases to 19.37% but also the standard deviation goes down to 19.59% with a resultant theta of 0.98. Thus, maximum diversification benefit is achieved. In this case the short-sale of stocks are restricted.
V.
12. Conclusion
Portfolio construction is the best way to reduce the risk of an investment. Given this set of investment opportunity, an investor can maximize the return while minimizing risk. In implementing this strategy, the investor has to keep in mind the strategy of passive investing. Trading on a frequent basis can wash out the level of profits suggested here. As most of the investors of Bangladesh do not possess superior investment prowess, this buy and hold strategy can be a solution to increasing investor confidence in the market.
| Company Name | Ticker | Industry |
| BRAC Bank Ltd. City Bank Ltd. | Bracbank Citybank | Banks |
| IDLC Finance Ltd. | Idlc | |
| BSRM Steels Ltd. IFAD Autos Ltd. | Bsrmsteel Ifadautos | Engineering |
| Olympic Industries | Olympic | Food And Allied |
| Ltd. | Product | |
| Summit Power Ltd. MJL Bangladesh Ltd. | Summitpower Mjlbd | Fuel & Power |
| Square | Squrpharma | |
| Pharmaceuticals Ltd. | Pharmaceuticals | |
| Beximco | Bxpharma | And Chemicals |
| Pharmaceuticals Ltd. | ||
| Lafarge Surma Cement Ltd. | Lafsurceml | Cement |
| Grameenphone Ltd. | Gp | Telecommunication |
| City | Brac | Idlc | Bs Steel | Ifad | Olym | Summit | Mjl | Square Pharma | Beximco Pharma | Lafarge | Gp | |
| Monthly Return | 0.006 0.016 -0.006 | 0.004 | 0.035 0.015 | -0.003 | 0.008 | 0.002 | 0.013 | 0.011 | 0.009 | |||
| Company | Weight |
| CITY | 0.00% |
| BRAC | 30.00% |
| IDLC | 0.00% |
| BS STEEL | 0.00% |
| IFAD | 30.00% |
| OLYMPIC | 15.52% |
| SUMMIT | 0.00% |
| MJL | 13.47% |
| SQUARE PHARMA | 0.00% |
| BEXIMCO PHARMA | 10.23% |
| LAFARGE | 0.00% |
| GP | 0.78% |
| The resultant annual portfolio excess return is | |
| 19.37% and annual standard deviation of 19.59% | |
| leading to the maximum Sharpe ratio of 0.98. The | |
| summary Sharpe ratio in the two cases is as per the | |
| below table: |
| Equal Weight Portfolio | Optimized Portfolio | ||
| Monthly Data | |||
| Portfolio Excess Return | 0.36% | 1.49% | |
| Portfolio | Standard | 6.44% | 5.66% |
| Deviation | |||
| Theta | 0.055 | 0.26 | |
| Annualized | |||
| Portfolio Annual Excess | 4.35% | 19.37% | |
| Return | |||
| Portfolio | Standard | 22.32% | 19.59% |
| Deviation | |||
| Theta (Annual) | 0.19 | 0.98 | |