1. Introduction
mutual fund is a trust consists of savings from the many distant investors and put them in securities like stocks, bonds, and short-term money market and commodities like gold. This trust is managed by professionals. The investors of mutual fund share the Author ?: Master of Business Administration, University of Chittagong; Lecturer, Bangladesh Army International University of Science & Technology, Bangladesh. e-mail: [email protected] Author ?: MSc. International Business Management (UWL, UK), MBA (University of Chittagong); Associate Professor, Department of Finance, University of Chittagong, Bangladesh. e-mail: [email protected] classes according to the fund's investment objective. The mutual fund gives an opportunity to the retail investors gain the advantage of professional financial control. A mutual fund is a mechanism to pull out savings from the retail sector. Their money is directly handled by the professional fund manager or indirectly pursued by an index or industry. The funds are spread into various sectors to avoid potential loss. Slimming down the effort of individual investors, they offer a smart way to manage their savings without paying high fees or requiring constant attention. Mutual fund facilitates and takes traditional and complex investment decision on behalf of investors who lack the time and knowledge. Investors trust the portfolio manager to make those crucial investment choices by investing in a mutual fund.
Investment Corporation of Bangladesh (ICB) launched by government in 1980 was the first ever Mutual Funds for the sake of investors and of the capital market. ICB subsequently offered a series of closed-end mutual funds. The first private sector to take initiative of organizing a mutual fund was Asset & Investment Management Services of Bangladesh Limited (AIMS) in 1999.Though the mutual fund industry grew over time there has only been close ended fund since the beginning of the mutual funds. The country's first ever open-end mutual fund hit market in the first quarter of 2010, expanding the orbit of stock market and providing shareholders a very useful and convenient investing vehicle. Prime Finance Asset Management Company Limited (PFAMCL) float the mutual fund, with initial size of Tk500 million. Performance evaluation of mutual funds is important for the investors and portfolio managers as well. Historical performance evaluation provide an opportunity to the investors to assess the performance of portfolio managers as to how much return has been generated and what risk level has been assumed in generating such returns.
In this research paper an attempt is made to analyze the performance of the growth oriented equity diversified schemes on the basis of return and risk evaluation. The analysis was achieved by assessing various financial tests like Average Return, Sharpe Ratio, Treynor Ratio, Standard Deviation, Beta and Coefficient of Determination (R2). Goel, Mani & Sharma (2012) had made a study titled "A review of performance indicators of mutual fund". This study wanted to identify the performance indicators and their impact on mutual fund performance. The impact of performance persistence, turnover, expense ratio, asset size, load fee, investment style, mutual fund managers and the ownership style on mutual fund performance was also elaborated in this study. And the discussion about the contradictions and the gap present in the literature regarding these performance indicators were also made. This paper revealed that the mutual fund companies having high turnover have performed well than companies with lower turnover and Expense ratio affects the performance of mutual funds positively. Larger asset base, Stock picking ability and lengthy tenure of fund managers are favorable for mutual fund performance. Their research also found that ownership style also influences mutual fund performance that meant foreign mutual fund performs less than local mutual fund. In this review it also concluded that there is no clear relationship between load fee & performance.
Abdullah M. N., Parvez K. (2012), in their researcher paper entitled "Corporate Governance of Mutual Fund In Bangladesh" have attempted to present a critical review of the requirements of mutual fund regulations in Bangladesh and their implementation by the various Assets Management Company's. The research basically theoretical in nature and based upon the secondary information extracted from various journals, articles and working papers, mostly the facts and views. The findings and observations are solely based on the first hand information extracted from the officials of the asset management companies. The researchers mentioned that Good governance entails real costs. Some of the costs include hiring dedicated staff such as corporate secretaries, experienced and independent directors, or other governance specialists. It will likely require the payment of fees to external counsel, auditors, and consultants. This might seem like a load of cost but in absence of good corporate governance, board fails to ensure controls, poor disclosure and transparency becomes commonplace, and shareholder rights are mistreated.
Annaert J., Broeck J. V. D. & Vennet R. V., (2001), had made an working paper entitled "Determinants of Mutual Fund Performance: A Bayesian Stochastic Frontier Approach" . The purpose of this paper is to identify readily available ex-ante fund statistics that can be related to future performance of European equity funds over the period 1995-1998. By using Jensen's alpha on the basis of stochastic frontier methodology, using cross-sectional data, the paper revealed that size and historical performance are related to fund efficiency. Larger funds tend to exhibit a higher degree of efficiency than small funds. Their findings suggest the presence of economies of scale and related to relatively larger capital inflows into successful funds. Further they found that poor performers tend to be less efficient in a subsequent period. Nevertheless, relatively good performance does not necessarily imply higher levels of efficiency. Finally, they didn't find crosssectional efficiency differences across age groups. ii. Sub Objectives
? To examine the trends in terms of growth, size and volume of mutual funds ? To evaluate the financial performance of selected mutual funds in Bangladesh
? To evaluate the performance of mutual funds in terms of models like sharpe, treynor, Jensen ratio ? To evaluate the performance as per investor view.
2. b) Sources of Data and Methodology
Annual reports of funds for the period from 2014 to 2015 and weekly NAV and close price of funds from June 2014-June 2016 have been used for data collection. For this purpose, different sources have been used; Asset Management Companies of the funds, Stock exchanges, DSE index. Data for Treasury bills rate was collected from publications of Bangladesh Bank.
Variables picked for the performance evaluation of close end mutual funds are weekly NAV and close price of funds, daily returns of DSE broad index, 9 months' treasury bill rates. Return of fund was calculated from weekly NAV and close price of fund. This study used three models which are accepted worldwide for the performance evaluation of mutual funds (1) Sharpe Measure (2) Treynor Measure (3) Jenson differential Measure.
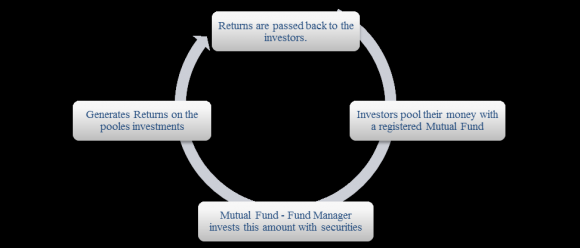
3. IV. Operation System of Mutual Fund
A mutual fund company collects savings from many distant investors and put them in securities like stocks, bonds, and short-term money market and commodities like gold, etc. This trust is managed by professionals with a good understanding of the market and tries to achieve common objectives of unit holders by making different strategic investment decisions.
The investors of mutual fund share the return as their invested share. The AMC is accountable for dealing the investment procedures by the mutual fund. It also provides supporting service like counselling, financial consultation, client support, accounting information management, marketing procedures and sales jobs for the mutual fund. The structure of a mutual fund is consisting of a sponsor, trustees, and an Asset Management Company, likewise known as AMC. The trust is formed by a sponsor(s), who act as a promoter of a company. As a mutual fund, the trust is listed within the BSEC (Bangladesh Security Exchange Commission). The properties of the mutual fund are treated by the trustee under the incentive of the benefit of unit holder. With the approval of BSEC, an Asset Management Company (AMC) takes care of the fund by investing in different types of sureties. The trustees are entrusted with the power of administering and directing the AMC. They supervise the operation of the mutual fund and obedience of BSEC regulations. The trustees are the core administration with general authority and dominance b) Mutual fund Schemes i. Based on the maturity period a. Open-ended Fund
Open ended funds without any fixed maturity period. These are presented for subscription and can be exchanged continuously throughout the year. The transaction comes at the prices in response to NAV (Net Asset Value). Liquidity is the central feature of this type of funds, as there is no restrictions regarding the amount of the share can be issued.
4. b. Close-ended Fund
Close-ended funds are with a definite maturity period. These are presented for subscription and can be exchanged continuously for a definite period at the initial launching point. These funds are listed on an acknowledged stock exchange and transaction is occurring at that point.
5. c. Interval Funds
Interval funds are the combination of the characteristics of both open-ended & close-ended funds. These types of funds can be exchanged in stock exchanges as well as are open for sale or redemption at fixed intervals along the usual NAV.
ii. Based on investment objectives a. Equity/Growth Funds Equity/Growth funds invest a major percentage of its fund in stocks under the incentive of long-term capital growth. Buying shares of an equity mutual fund, allows investors to become a part owner the securities in the fund's portfolio. Equity funds invest at least 65% of its fund in equity and equity related securities. These funds may invest in different industries or one focused industry. From a long-term viewpoint and higher risk appetite, these types of funds are appropriate for investors.
6. b. Debt/Income Funds
Debt/Income funds usually invest minimum 65% of its fund in fixed income securities like bonds, corporate debenture, govt. securities and money market instruments. To lower risk of the investor and to provide a stable income, these funds invest in debt instruments with preservation of capital. The fluctuation tendency of these funds is comparatively lower than equity funds and generates a regular income flow. This type of funds is perfect for safe players.
7. c. Balanced Funds
With predetermined objectives, balanced funds provide opportunities for the investors to put their fund in both line of funds, equities and fixed income instruments. These funds secure return on investment as well as the preservation of capital. Most importantly, balanced funds are perfect for those investors who intend to have a moderate growth with income. They follow a pattern to invest their money around 60% in equity instruments and 40% in debt instruments.
8. e. Gilt Funds
Gilt funds are especially invested in govt. Securities. Though there is nothing to worry about the return, but there is risk of interest rate fluctuation. Govt. Securities are safer as the gift ensures the return for the investors.
9. c) Mutual funds in Bangladesh
In 1980, the country's first mutual fund was launched by the Investment Corporation of Bangladesh for providing new investment tools to investors. In 1999, Asset & Investment management services of Bangladesh (AIMS) as a first private AMC took initiative to introduce mutual fund.
Up to 2009, there was only close end mutual fund existed in the capital market. In the last quarter of 2010, Prime Finance Asset Management Company Limited (PFAMCL) launched country's first open end mutual fund. Total market capitalization of mutual fund is only 28 billion taka, which is less than 1% of total market capitalization of 3107 billion taka. Performance analysis of mutual fund: d. Money Market/ Liquid Funds Money market/ Liquid funds are for the safety seeker investors. These funds invest in short-term instruments that means generally invest in certificates of deposit, treasury bills and commercial papers for a full stop of less than 91 days. It is also safe to play. The objective of such funds is to ensure easy liquidity for the investors. These types of funds are perfect for using surplus funds in an optimum level by ensuring a moderate income within a little period. V.
10. Performance Analysis of Mutual Funds a) Sharpe ratio
Sharpe ratio was developed in 1966 by William Forsyth Sharpe. This ratio is also called reward to volatility ratio. Sharpe ratio is a useful formula to know the performance of the portfolio. It is used to measure the return from an investment against per unit of risk. Here portfolio risk premium is divided by standard deviation of a portfolio; this measure reveals the risk premium is divided by standard deviation of a portfolio. Total risk is used in this ratio to measure the performance of a portfolio.
The higher the result of Sharpe ratio, the more the fund is fit for investment and vice versa. This ratio explains that how much return investor remunerated against the risk taken. It also indicates the efficiency of fund managers that how much return the generated and how well they can diversify their portfolio. That means Sharpe ratio evaluates the portfolio manager in terms of rate of return and diversification. The study calculates the Sharpe ratio on daily historical returns of 32 mutual funds for 2 years' period i.e. June 2014-2016. And the study uses one-year treasury bills rates are as the riskfree rate of return.
Here the results of the study indicate that only two funds out of thirty-seven funds having the positive return. This scenario provides evident that most of fund manager are not efficient to give reasonable returns on funds and their incapacity to diversify in winning manner.
The highest performing mutual fund is NLI1ST mutual fund having Sharpe ratio 1.35% based on weekly return from weekly NAV and the lowest performing mutual fund having Sharpe ratio -11.62%.
11. Global Journal of Management and Business Research
Volume XVI Issue IX Version I Year ( )
12. b) Treynor Ratio
Treynor ratio is the measurement of portfolio performance by taking relationships between annualized risk adjusted return and risk. Treynor ratio use systematic risk that means market risk (measured by beta) instead of total risk (measured by standard deviation). This ratio measures investment's sensitivity to market movements and tries to measure how successful an investment in providing investor's compensation. The high value of Treynor ratio shows an indication of that an investor gained high return on each of the market risks he has taken. In case of portfolio, Treynor ratio provides investor an idea how efficiently capital is being used. This ratio helps to measure returns from per unit of systematic risk. The mutual fund which provides highest return per unit of risk is generally being preferred as compared to the fund provides low return per unit of risk. Formula of Treynor ratio = (RI -Rf) / beta Where:
? RI = average rate of return for an investment ? Rf = risk-free rate From the 32 mutual funds, only 1 mutual funds have the positive treynor ratio. That means maximum fund could not run well in relation to market risk. EBL1ST mutual fund got the positive treynor ratio that means this fund get the highest return in relation to systematic risk. 31 fund got the negative treynor ratio. It indicates that these funds could not cope with the market risk. Fund performance of ICBISTNRB indicates that return of this fund is very low in relation to per unit of systematic risk.
13. c) Jensen Alpha
Jensen alpha measures the risk of adjusted performance of portfolio in relation to expected rate of return (measured by CAPM). Jensen Alpha is also known as Jensen performance index and Jensen measure. Jenson alpha is important to investor, because investors require not only focusing at the total return of portfolio, but also the amount of risk involved in achieving return. This measurement how is the way to measure whether portfolio is earning proper return in relation to level of risk.
Only 11 fund could achieve positive Jensen alpha. EBL1ST fund got the highest Jensen Alpha. Over all Jensen alpha indicates that 21 mutual fund perform less than expected rate of return measured by CAPM. But this does not mean that these 11 fund perform well. It is true that they perform better than overall market whereas market provide only 0.02% weekly return, which is less than one-year treasury bill weekly return 0.11%.
14. Performance as per investor view:
Table 3 4, show that in the last two years from June 2014 to June 2016 mutual funds, on average earned return of -0.0043 percent weekly with the standard deviation of 0.00092 weekly based on weekly NAV, whereas average market return of DSE30 index in this period was 0.08546 percent weekly with the standard deviation of 0.02113 weekly which indicates the DSE30 index performance was better than mutual funds. But the overall performance of DSE was not good because several market scam leads to less confident in investor in this market. Mutual fund must hold 60% of fund in stock market mandatorily according to law. For this reasons, mutual fund could not take their decisions in accordance with fundamental analysis.
15. VI.
16. Conclusion
This paper provides an overview of the Bangladeshi mutual fund industry and investigates the mutual funds risk adjusted performance using mutual fund performance evaluation models. Mutual fund industry in Bangladeshi is still in growing phase. Result shows that on overall basis, funds industry underperform than the market. They are investing in the market very defensively as evident from their beta. Mutual Fund industry's Sharpe ratio is -4.87% as compared to market that is -0.09 risk premium per one percent of standard deviation. Results of Jensen differential measure also show negative after cost alpha. Hence overall results suggest that mutual funds in Bangladesh are going on a trouble system. Whereas results also show some of the funds outperform, these funds are not facing the diversification problem. Worldwide there had been a tremendous growth in this industry; this growth in mutual funds worldwide is because of the overall growth in both the size and maturity of many foreign capital markets, but the conditions of mutual fund industry in Bangladesh are far behind. The funds should disclose the level of risk associated with return in their annual reports for the information of investors and prospective investors. This will enable the investors to compare the level of return with the level of risk. The success of this sector depends on the performance of funds industry and the role of regulatory bodies. Excellent performance and stringent regulations will increase the popularity of mutual funds in Bangladesh.
17. Global
18. C
Performance of mutual fund is measured based net assets value of fund. An investor takes decision to invest in mutual fund by observing NAV of respective fund. But after 2010 share scam, most of fund is traded now in market less than NAV even less than their face value. For this reasons return from mutual fund is also calculated in this paper based on weekly close price of mutual fund to know the gain of investor or trader from mutual fund. After analysis, this paper identifies that 9 fund have positive Sharpe ratio, from which ICBAMCL2ND fund got the highest Sharpe ratio and TRUST mutual fund got the lowest Sharpe ratio. Out of 32 mutual funds only 7 funds have positive Treynor ratio. That indicates that most of the fund could not do well in relation to market risk. 12 funds have the positive Jensen alpha. That means these 12 fund manager do well than the expected return from fund.
| attributes, and country characteristics worldwide. The | |
| study was based on a sample of 10,568 open end | |
| actively managed equity funds from 19 Asian countries | |
| covering the periods of 1999 to 2005. The researchers | |
| measured performance of the mutual fund on the basis | |
| of four alternative benchmark models including a | |
| domestic and international version of the Carhart four- | |
| factor model. The results of this study indicate that large | |
| funds in generally perform better due to economics of | |
| scale in fund management and newer funds also are | |
| able to gain better performance. Their findings | |
| concluded that individual manager with more experience | |
| can achieve high performance in funds that are | |
| associated with higher fees. Strong legal frameworks in | |
| countries lead better performance in mutual fund than | |
| weak legal framework based countries. Due to quick | |
| liquid stock markets domestic funds located in | |
| developed countries perform better. Further they found | |
| that In case of investing abroad two important factors- | |
| familiarity & proximity enhances the performance of | |
| mutual fund. | |
| 11,25,398 million. In the financial year 2013-14, the total | |
| trading days was 239 days, average number of traded | |
| securities was 102 million and average transaction was | |
| Tk. 4,709 million. | |
| At the end of FY 2013-14 total number of listed | |
| mutual funds stood 41 with unit value of Tk. 40,804.41 | |
| million and market value of Tk. 34.31 billion. At the | |
| beginning of the FY 2014-15, total 41Mutual Funds were | |
| listed with unit value of Tk. 40,804.41mn. During the FY | |
| 2014-15 new 1mutual fund got listed through IPO with | |
| unit value of Tk. 605.91 million. and 1 mutual fund | |
| delisted during the FY 2014-15. at the end of FY 2014-15 | |
| total number of listed mutual funds stood 41 with unit | |
| value of Tk. 43,650.12 million and market value of Tk. | |
| 28.85 billion. Mutual fund represents 1.07% of total | |
| tradable market capitalization in FY 2014-15 where as it | |
| was 1.44 in the FY 2013-14. At the end of FY 2015-16, | |
| total number of listed mutual funds stood 36 with market | |
| value 26707.79 million and it was only 1.09 % of total | |
| market capitalization. | |
| III. | Literature Review |
| Ferreira, M., Miguel, A., & Ramos, S. (2006) | |
| conducted a cross-country study to investigate the | |
| relationship between mutual fund performance, fund | |
| No. | Name of mutual fund | Listing year | No. | Name of mutual fund | Listing year |
| 1 | 2NDICB (2nd ICB M.F.) | 1984 | 17 | ICB AMCL Third NRB Mutual Fund | 2010 |
| 2 | 3RDICB (3rd ICB M.F.) | 1985 | 18 | IFIC Bank 1st Mutual Fund | 2010 |
| 3 | 4THICB (4th ICB M.F.) | 1986 | 19 | IFIL Islamic Mutual Fund-1 | 2010 |
| 4 | 6THICB (6th ICB M.F.) | 1987 | 20 | Phoenix Finance 1st Mutual Fund | 2010 |
| 5 | 5THICB (5th ICB M.F.) | 1989 | 21 | PHP First Mutual Fund | 2010 |
| 6 | 7THICB (7th ICB M.F.) | 1995 | 22 | Popular Life First Mutual Fund | 2010 |
| 7 | 8THICB (8th ICB M.F.) | 1996 | 23 | Prime Bank 1st ICB AMCL Mutual Fund | 2010 |
| 8 | Grameen One: Scheme Two | 2008 | 24 | Trust Bank 1st Mutual Fund | 2010 |
| 9 | ICB AMCL 2nd NRB Mutual Fund | 2008 | 25 | AIBL 1st Islamic Mutual Fund | 2011 |
| 10 EBL First Mutual Fund | 2009 | 26 | EBL NRB Mutual Fund | 2011 | |
| 11 Prime Finance First Mutual Fund | 2009 | 27 | LR Global Bangladesh Mutual Fund | 2011 | |
| One | |||||
| 12 ICB AMCL Second Mutual Fund | 2009 | 28 | MBL 1st Mutual Fund | 2011 | |
| 13 ICB Employees Provident MF 1: Scheme | 2009 | 29 | LR Global Bangladesh Mutual Fund | 2011 | |
| 1 | One | ||||
| 14 First Janata Bank Mutual Fund | 2010 | 30 | MBL 1st Mutual Fund | 2011 | |
| 15 DBH First Mutual Fund | 2010 | ||||
| 16 Green Delta Mutual Fund | 2010 | ||||
| Mutual Fund Trading Code | SR | TR | Jensen alpha | CAPM |
| 1JANATA | -6.01% -0.36% | -0.08% | 0.09% | |
| ABB1ST | -9.82% -0.52% | -0.12% | 0.09% | |
| AIBL1ST | -0.86% -0.03% | 0.03% | 0.06% | |
| DBH1ST | -2.36% -0.07% | 0.01% | 0.06% | |
| EBL1ST | 0.09% | 0.00% | 0.06% | 0.06% |
| EXIM1ST | -6.66% -0.61% | -0.13% | 0.09% | |
| EBLNRB | -7.34% -0.24% | -0.07% | 0.07% | |
| 8THICB | -7.14% -0.39% | -0.27% | 0.03% | |
| FBFIF | -5.23% -0.72% | -0.09% | 0.10% | |
| GRMEENS2 | -8.89% -0.43% | -0.15% | 0.07% | |
| GREENDELMF | -2.29% -0.07% | 0.01% | 0.07% | |
| IFIC1STMF | -6.04% -0.21% | -0.06% | 0.07% | |
| IFILISMF1 | -1.88% -0.16% | -0.03% | 0.07% | |
| LRGLOBALMF1 | -5.21% -0.25% | -0.08% | 0.07% | |
| MBL1STMF | -1.63% -0.06% | 0.02% | 0.06% | |
| NCCBLMF1 | -6.10% -0.21% | -0.06% | 0.06% | |
| NLI1STMF | 1.35% | 0.10% | 0.05% | 0.09% |
| PHPMFI | -6.16% -0.22% | -0.05% | 0.07% | |
| PF1STMF | -1.61% -0.04% | 0.05% | 0.02% | |
| POPULAR1MF | -11.62% -0.55% | -0.15% | 0.08% | |
| PRIME1ICBA | -2.67% -0.07% | 0.02% | 0.03% | |
| RELIANCE1 | -7.23% -0.30% | -0.10% | 0.07% | |
| SEBIST | -0.23% -0.01% | 0.03% | 0.08% | |
| TRUST | -3.92% -0.15% | -0.03% | 0.07% | |
| 6th ICB | -7.74% -0.40% | -0.28% | 0.03% | |
| 7THICB | -5.42% -0.23% | -0.14% | 0.02% | |
| ICBEP | -2.74% -0.08% | 0.01% | 0.02% | |
| ICBAMCL2ND | -2.24% -0.06% | 0.03% | 0.02% | |
| ICB3RDNRB | -4.79% -0.12% | -0.03% | 0.03% | |
| ICB2NDNRB | -4.02% -0.11% | -0.02% | 0.03% | |
| ICBISTNRB | -7.94% -0.23% | -0.14% | 0.02% | |
| ICBSONALI | -11.40% -0.42% | -0.21% | 0.05% | |
| Mutual Fund Trading Code | SR | TR | Jensen alpha CAPM | Year | |
| 1JANATA | -7.26% -0.41% | -0.20% | 0.06% | ||
| ABB1ST | -8.84% -0.44% | -0.26% | 0.05% | ||
| AIBL1ST DBH1ST EBL1ST EXIM1ST EBLNRB 8THICB FBFIF GRMEENS2 GREENDELMF IFIC1STMF | 3.88% -0.39% -0.03% 0.48% -5.68% -0.39% -3.80% -0.79% -7.07% -0.36% -0.53% -0.04% 8.91% -1.56% -10.79% -0.62% 1.36% 0.09% -8.98% -0.50% | 0.32% 0.03% -0.21% -0.22% -0.28% 0.02% 7.91% -0.34% 0.12% -0.27% | 0.06% 0.07% 0.05% 0.08% 0.02% 0.07% 0.59% 0.05% 0.06% 0.05% | Volume XVI Issue IX Version I ( ) | |
| IFILISMF1 LRGLOBALMF1 MBL1STMF NCCBLMF1 NLI1STMF PHPMFI PF1STMF POPULAR1MF PRIME1ICBA RELIANCE1 SEBIST TRUST 6th ICB 7THICB ICBEP | -0.12% -0.01% -1.20% -0.10% 0.42% 0.03% -5.47% -0.53% 5.07% 0.73% -5.50% -0.61% -3.51% -0.22% -9.22% -0.56% -2.34% -0.17% -3.34% -0.16% 6.12% 0.89% -9.04% -0.53% -5.40% -0.58% 2.77% 0.51% 3.58% 0.36% | 0.07% -0.01% 0.09% -0.22% 0.18% -0.21% -0.08% -0.28% -0.04% -0.06% 0.22% -0.29% -0.16% 0.17% 0.23% | 0.03% 0.05% 0.04% 0.07% 0.09% 0.08% 0.06% 0.06% 0.06% 0.04% 0.09% 0.05% 0.08% 0.09% 0.07% | Global Journal of Management and Business Research | |
| ICBAMCL2ND | 8.89% | -1.70% | 7.82% | 0.54% | |
| ICB3RDNRB | -5.60% -0.39% | -0.12% | 0.08% | ||
| ICB2NDNRB | -5.70% -0.36% | -0.18% | 0.05% | ||
| ICBISTNRB | -9.66% -0.76% | -0.40% | 0.06% | ||
| ICBSONALI | -7.95% -0.47% | -0.29% | 0.04% | ||
| Performance of Mutual Fund (Weekly NAV) | Performance of Mutual Fund (Weekly Close price) | Performance of DSE30 | |||
| Average return | -0.0043% | Average return | 0.49947% | Average return | 0.08456% |
| Standard Deviation | 0.00092 | Standard Deviation | 0.02056 | Standard Deviation | 0.02113 |
| Maxima | 0.136% | Maxima | 8.498% | Maxima | 6.310% |
| Minima | -0.253% | Minima | -0.345% | Minima | -4.531% |
| Median | 0.0074% | Median | -0.0361% | Median | -0.2237% |