1. Introduction
onsumer behavior is the study of individuals, groups, or organizations and the processes they use to select, secure, use, and dispose of products, services, experiences, or ideas to satisfy needs and the impacts that these processes have on the consumer and society. It attempts to understand the decision-making processes of buyers, both individually and in groups. It endeavors to comprehend the basic leadership procedures of purchasers, both separately and in gatherings. It contemplates qualities of individual buyers, for example, demographics and behavioral variables trying to comprehend individuals' needs. It likewise tries to survey impacts on the buyer from gatherings, for example, family, companions, reference gatherings, and society when all is said in done.
Consumer behavior alludes to the demonstration of expending merchandise or administrations. In the expressions of Glenn Wilters, "Human behavior refers to the total process by which individuals interact with their environment". Consumer behavior is the procedure by which people choose whether, what, when, where, how and from whom to buy products and administrations. Knowledge of consumer behavior would render monstrous help for arranging and executing marketing strategy. The shopper figures out what a business is ?.Peter F. Drucker. Consumer behavior is the act of consuming a goods or service. In simpler, every customer shows inclination towards particular products and services that available in the market. Customer interest is nothing but willingness of consumers to purchase products and services as per their taste, need and of course pocket.
2. II.
3. Indian Telecom Industry
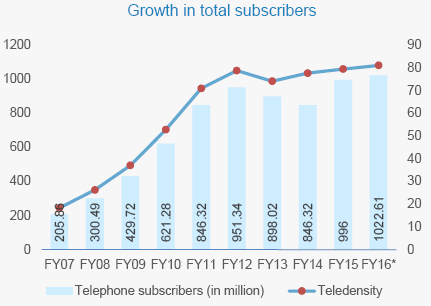
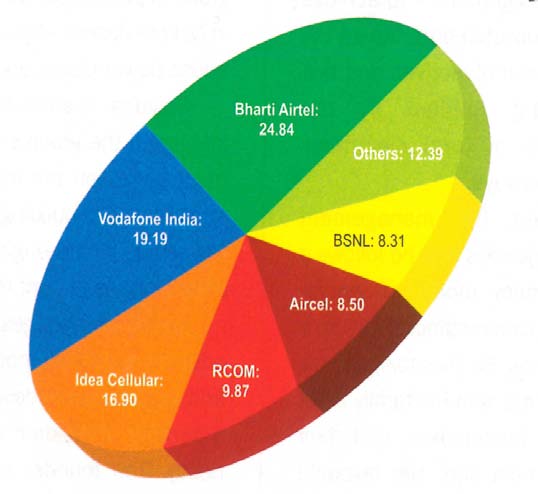
In India, Telecommunication begun in 1882 in Kolkata, this was less than 5 years after the invention of the telephone by Alexander Graham Bell. India's telecom network was notoriously unreliable and only available to a small section approximately 3.05 million connections in 1984. Cellular service was launched in November 1995 in Kolkata first after liberalization gradually took place. The Indian telecom industry has grown rapidly during the last few years. India has the third largest telecom network in the world and the second largest mobile network with a subscriber base expanded at a CAGR of 19.5 percent to 1022.61 million over FY2007-15. By end of September, 2015, Urban tele density stood at 152.76 per cent and rural tele density at 48.66 per cent. Besides, projections by a few driving worldwide consultancies demonstrate that the aggregate number of subscribers in India will surpass the aggregate subscriber count in the China by 2020. The underlying business trend of incumbents gaining market-share from fringe players continued with top three players, ie. Bharti Airtel, Vodafone and Idea scored market-share of 31.4 percent, 23 per cent and 19.1 per cent respectively. According to the recent study by the Cellular Operators Association of India, Bharti Airtel continues to dominate the mobile segment in terms of highest market share and the total market share with these three big giants arrives to 73.4 per cent. The three big boys of Indian telecom Bharti Airtel, Vodafone and Idea -continued to dominate the telecom industry and all three large incumbents increased their revenue market-share (RMS), mainly because of new subscribers.
4. a) Mobile Network Statistics
5. Source: Cellular Operators Association of India; Association of Unified Telecom Service Providers of India
The small players are losing out to the big players, who have stepped up investments to improve data penetration and coverage. These small players are struggling to keep pace with the changing consumer preferences.
6. b) Some Facts and Figures on Indian Telecom
7. c) Celluar Industry in Hosur
In Hosur, there are 8 cell administration suppliers. They are IDEA, Bharti Airtel, Vodafone, BSNL, Aircel, Uninor, Tata Indicom and Reliance. Bharti Airtel is the market leader in the wireless segment among the players in Hosur Town.
8. d) Need for the Study
The accomplishment of telecom industry relies on upon reasonable endeavors and attainable investments. In a focused business sector, administration suppliers are relied upon to contend on both cost and nature of administrations furthermore it is essential for the administration suppliers to meet the consumers' requirements and desires in cost and administration quality. After globalization of Indian economy in 1991 the telecom segment stayed a standout amongst the most event sectors in India. Recent years have seen and sensational changes in the field of telecom. In the last few years of years more companies both foreign and domestic, entered the cell service market and offer substantial number of products and services to the clients.
9. e) Objectives of the Study
The following are the specific objectives of the present study:
? To study the choice of brands by the consumers and the reasons for the same and ? To know the problems faced by the customers with their mobile services in the selected town. ? To evaluate respondents' perception on the cellular services.
III.
10. Methodology and Sampling
The study is based on both primary and secondary data sources. A questionnaire has been prepared with different questions to examine the socioeconomic status and consumer perception on cellular services. A sample of 200 respondents has been selected based on convenience sampling method. The sampling includes male and female users from different occupations, age, and religion and income background. The secondary data has been collected from the books, journals, periodicals and magazines. For analyzing the data, statistical tables, percentages and chi-square test were used.
IV.
11. Analysis of the Study
The distribution of the sample respondents on the basis of their sex, age, literacy level, occupational status and monthly family income is presented in the following tables. Source: Primary data Inference Among the 200 respondents, 130 respondents are male and the rest of 70 respondents are female.
12. a) Gender of the Respondents
Though both male and female are aware of the cell phone usage, female have some problems in using the cell phone due to income and family background.
13. b) Age Composition
14. c) Education
The level of education is an important factor in building up strong and stable labor force needed by any industry. The literacy level of the sample respondents is given in Table 3.
15. Inference
The study revealed that 33 per cent of the respondents were under graduates and 30 per cent were graduation degree holders. 13 per cent of the respondents have been educated up to school level, 12 per cent were professionals and 12 per cent of the respondents belong to other category groups.
16. d) Occupational Status
The occupation of the sample respondents is given in Table 4 below.
17. Inference
Out of 200 respondents, 24 per cent are engaged in business, 23 per cent of the respondents belong to professional category, 22 per cent of the respondents belong to employed category. 20 per cent of the respondents fall under other category and 11 per cent of the respondents are students.
18. e) Monthly Income
The status and standard of living of a person is determined by the income he/she gets on monthly basis. Generally, the main source of income of respondents is salary. The distribution of the respondents based on their monthly income is given in Table 5.
19. f) Consumer Behaviour towards Cell Phone Users
Consumer behavior towards cell phone users based on their satisfaction, billing pattern, motivation, mobile service, advertisement and attitude of the respondents, which is presented in the following tables.
20. g) Motivation
Motivation is the driving force within individuals that impels them to action. Motivation is the activation or energization of goal-oriented behavior. Motivation may be intrinsic or extrinsic.
21. Inference
Majority of the respondents are motivated by their close friends to buy cell phones and 24 per cent of the respondents are motivated by their relatives to buy cell phones. 8.5 per cent of the respondents having selfdesire to buy cell phones by attraction and followed by 7.50 per cent indent from their colleagues.
22. h) Attitude
Consumer attitudes consist of a combination of cognitive information and beliefs, emotions and behavioral intention regarding a consumer product or service. Attitude is the most important factor for deciding the communication. Inference 48 per cent of the respondents agree with the statement that cell phone is cheaper mode of communication. 36.5 per cent of the respondents strongly agree with the statement that cell phone is a cheaper mode of communication. 7 per cent only disagree with the above statement and 6 per cent of the respondents' opinion is neutral. Balance 2.5 per cent of the respondent's opinion is strongly disagreeing with the above statement.
23. i) Satisfacation
Satisfaction or dissatisfaction is the result of various attitudes the person holds towards his job, related factors and towards life in general. It is an important element to create demand for the product. If the consumers are satisfied with their purchase of cell phone, then they themselves act as advertisers and publicity to others.
24. Inference
Majority of the respondents are satisfied with the mobile services. 82.5 per cent of both the male and female respondents are satisfied with their mobile services and only 17.5 per cent of the respondents are dissatisfied with mobile services.
25. Null Hypothesis
The association between the mobile services opted by the respondents and their level of satisfaction towards the services of mobile network is not significant. The calculated ?2 value (0.769) is less than the table value (3.84) at 5 percent level of significance for 1 degree of freedom, the null hypothesis is accepted and it could be concluded that the association between the mobile services opted by the respondents and their level of satisfaction towards the services of mobile network is not significant.
26. j) Billing Pattern
Billing pattern is another dimension of consumer behavior. Source: Primary Data Inference Majority of the respondents, 30 per cent opinion that billing pattern of the mobile services is fair. 27.5 per cent of the respondents opine that billing pattern offered by mobile service is good. Rest 4.5 per cent of the respondents felt that billing pattern offered by their mobile service is very poor.
Most of the respondents' opinion about billing pattern is fair, because it is complicated and not understandable to the respondents. Rates and tariffs are being changed by different mobile services often.
27. Null Hypothesis
The association between the opinion of the respondents on billing pattern and their level of satisfaction derived by them is not significant. The calculated ?2 value (2.88) is less than the table value (9.49) at 5 percent level of significance for 4 degree of freedom, the null hypothesis is accepted and it should be concluded that the association between the opinion of the respondents on billing pattern and their level of satisfaction derived by them is not significant. For easier billing pattern the dealers can arrange for any novel system, which may attract consumers.
28. k) Mobile Service Advertisement
Advertising is any paid form of non-personal presentation and promotion of a product, service, idea, company, person or anything that is offer to the consumers by an identified sponsor. 'Survival of the fittest' is the proverb, which is, practiced everywhere. Dealers and the company should choose different media for advertisement.
29. Inference
The above table reveals that majority of the respondents (60 per cent) are satisfied with the advertisement, 40 per cent of the respondents are not satisfied with the advertisement of mobile services and fell that the advertisements should be improved with good quality.
30. Null Hypothesis
The association between the opinion of the respondents about mobile service advertisement and their level of satisfaction derived by them is not significant. The calculated ?2 value (0.40) is less than the table value (5.99) at 5 per cent level of significance for 2 degrees of freedom, the null hypothesis is accepted and it should be concluded that the association between the opinion of the respondents about mobile service advertisement and their level of satisfaction derived by them is not significant.
V.
31. Findings
The following are the findings of the study: ? 65 per cent of the respondents who use cell phone are male. ? The highest number of employees (58 per cent) belongs to up to 30 years age groups. ? 33 per cent of the respondents were under graduates and 30 percent were post graduation degree holders. ? 24 percent are engaged in business, 23 per cent of the respondents belong to professional category, 22 percent of the respondents belong to employed category. ? 47 per cent of the respondents have monthly income rated between Rs. 10,000 to 15,000. ? Three fifth of the respondents (60 per cent) are motivated by their close friends to avail the mobile services. ? 48 per cent of the respondents agree with the statement that cell phone is cheaper mode of communication. In overall 84 percent agrees that cell phone is offered at cheaper rate. ? 82.5 per cent of both the male and female respondents are satisfied with their mobile services offered by the service providers. ? Majority of the respondents (30 per cent) opinion that billing pattern offered by the mobile services is at fair level. ? Most of the respondents (60 per cent) are satisfied with the advertisement given by mobile services.
VI.
32. Suggestions
? Price plays a significant role in lower income group in terms of purchase decision of the telecommunication service. ? Price has significant positive impact on consumer perception choice in selecting telecommunication service provider. ? Product quality from the marketer's perspective is associated with communication, price, feature, function, or performance of a product. ? Consumers regularly face the task of estimating product quality under conditions of imperfect knowledge about the underlying attributes of the various product offers with the aid of personal, selfperceived quality criteria. ? Enormous facilities can be included in the cell phones. ? For Females, New model hand set can introduce exclusively in the market with safety features and in terms of comfort handling.
? The Cellular companies can introduce various kinds of sales promotional activities. ? A company that offers lower charges would be able to attract more customers committing themselves to the telephone networks and significant number of "call minutes" may achieve.
VII.
33. Conclusion
The telecommunication sector, especially the mobile phone sector, in India is one of the fastest growing business segments of the country, which provide a lot of value addition to the society with its service, and creation of employment opportunities. The success of telecommunication industry depends on prudent efforts and feasible investments. In a competitive market, service providers expected to compete on both price and quality of services and it is necessary for the service providers to meet the consumers' requirements and expectations in price and service quality. Hosur offers a big market and any service provider who offers good service at a reasonable cost will be able to capture the market in this town. Though by offering concessions and by extensive advertisement, a provider may capture the market in the short run, the quality of service provided will only enable a player to service in the highly competitive market in the long run.
Telecommunication in India is one of the prime support services needed for rapid growth and modernization of various sectors of the economy. The policies and regulatory frame works implemented by the regulator (TRAI), created a potential environment for service providers and has attractive opportunities. The Government has been proactive in its efforts to transform India into a global telecommunication hub; prudent regulatory support has also helped by introducing Digital India program under which all the sectors will be connected through internet.

| Operator Name | Wireless Subscriber base (in Millions) |
| Bharti Airtel | 226 |
| Vodafone Essar | 184 |
| Reliance Communications | 109 |
| Idea Cellular Limited | 158 |
| Bharat Sanchar Nigam Limited (BSNL) | 77 |
| Tata Teleservices Limited | 66 |
| Aircel / Dishnet | 81 |
| Telewings | 46 |
| Source: Indian Telecommunications |
| ? 4G Technology service is estimated to reach a |
| compounded annual growth rate (CAGR) of 26.6% |
| during the period from 2015-2020. |
| 2016 |
| Year |
| Volume XVI Issue III Version I |
| ( ) E |
| Global Journal of Management and Business Research |
| Gender | No. of Respondent | Percentage |
| Male | 130 | 65% |
| Female | 70 | 35% |
| Total | 200 | 100% |
| Age Group (years) | No.of Respondents | Percentage |
| Below 30 | 116 | 58% |
| 31-45 | 62 | 31% |
| Above 46 | 22 | 11% |
| Total | 200 | 100% |
| Source: Primary data |
| Literacy Level | No.of. Respondents | Percentage |
| School Level | 26 | 13% |
| Under Graduation | 66 | 33% |
| Graduation | 60 | 30% |
| Professional Degrees | 24 | 12% |
| Others | 24 | 12% |
| Total | 200 | 100% |
| Source: Primary data |
| Occupation | No. of. Respondents | Percentage |
| Employed | 44 | 22% |
| Business | 48 | 24% |
| Profession | 46 | 23% |
| Student | 22 | 11% |
| Others | 40 | 20% |
| Total | 200 | 100% |
| Source: Primary Data |
| Income(Rs) | No. of. Respondents | Percentage | |
| Up to 10,000 | 76 | 38% | |
| 10,001-15,000 | 94 | 47% | |
| Above 15,001 | 30 | 15% | |
| Total | 200 | 100% | |
| Source: Primary Data | |||
| Inference | have monthly income up to Rs. 10,000. Balance 15 per | ||
| It reveals out of 200 respondents, 47 per cent of | cent of the respondents are falling under above | ||
| the respondents have monthly income rated between | Rs.15,001 and above level of monthly income group. | ||
| Rs. 10,001 to 15,000 and 38 per cent of the respondents | |||
| Induced By | No.of. Respondents | Percentage |
| Friends | 120 | 60% |
| Relatives | 48 | 24% |
| Colleagues | 15 | 7.5% |
| Self Desire | 17 | 8.5% |
| Total | 200 | 100% |
| Source: Primary Data |
| Opinion | No. of. Respondents | Percentage |
| Strongly Agree | 73 | 36.5% |
| Agree | 96 | 48% |
| Neutral | 12 | 6% |
| Disagree | 14 | 7% |
| Strongly Disagree | 05 | 2.5% |
| Total | 200 | 100% |
| Source: Primary Data |
| Level of Satisfaction | Number of Respondents Male Female | Total | |
| Satisfied | 105 | 60 | 165 |
| Dissatisfied | 25 | 10 | 35 |
| Total | 130 | 70 | 200 |
| Source: Primary Data | |||
| Opinion | Number of Respondents Male Female | Total | |
| Excellent | 24 | 16 | 40 |
| Good | 38 | 17 | 55 |
| Fair | 42 | 18 | 60 |
| Poor | 20 | 16 | 36 |
| Very Poor | 06 | 03 | 09 |
| Total | 130 | 70 | 200 |
| Description | Number of Respondents Male Female | Total | |
| Satisfactory | 80 | 40 | 120 |
| Unsatisfactory | 28 | 16 | 44 |
| Should be Improved | 22 | 14 | 36 |
| Total | 130 | 70 | 200 |
| Source: Primary Data | |||