1. Introduction
ver the years, there have been considerable interests and debates on the degree of influence that international trade exerts on the economic growth of any nation. Some frames of thought argue that increased trade activities across the borders expand the market for a country's product and make the economy attract benefits from increasing returns to scale as well as international specialization Ades and Glasea (1999), Romer (1989).
Government on the other hand, are made to exhibit a greater measure of macroeconomic discipline and avoid disruptive policy direction as they attempt to keep abreast with the demands of international competition Rajan and Zingales (2003). Economies of the world has become so intertwined that it has become apparently difficult, if not impossible, for any economy to function in isolation. Gullespie, Jeanets and Hennessey (2004) observe that there is a continuing collapse of economic/trade borders and fronts and a blend of the world into one large market. Never in history have economic and trade doors been made as wide open as what we have in the world today.
With this widening trade doors comes the question of the extent to which this openness drive economic growth in nations of the world. The simple expectation is that trade openness should attract Foreign Direct Investment (FDI) which would engineer greater productivity and by extension economic growth and development.
In a country like Nigeria where the primary focus is on oil with all other exportable products seemingly held constant and the outrageous level of importation, does the perceived positive and significant influence of openness and economic growth hold waters. It is on this premise that a study of openness and economic growth is considered imperative using empirical evidence from Nigeria.
The paper is thus divided into five sections. Section one is introduction to the topic, section two reviews the literature on the topic, section three contains the methodology for the empirical studies, section four presents the analyses of data and discussion of findings while section five has summary and conclusions.
2. II.
3. Literature Review
Looking at literature on a global scale, there are some evidences for and against the relationship between trade openness and economic growth.
Jenkins and Sen (2006) investigated trade flows and economic growth in four Asian and African countries. A three-case-study methodological approach was used. Factor content, growth accounting and economic modelling were adopted. The result shows that a positive relationship exists in the four countries between trade openness and economic growth.
On the other hand, Dudley and Karski (2001) studied 10 countries between 1960 to 1989 with the view to establishing whether trade openness positively affect economic growth. The findings were polarised. While evidences for three countries agree that there is a positive relationship between trade openness and economic growth, three countries show negative evidence between trade openness and economic growth. The other four countries' evidence showed neither negative nor positive relationship between economic growth and trade openness.
Mercanet.al (2013) studied the effect of trade openness on economic growth for most rapidly developing/develpoed countries (emerging markets; Brazil, Russia, India, China and Turkey, BRIC-T) via panel data analysis using the annualized dataset of the period 1989 to 2010.. According to empirical evidence derived from the study it was found out that the effect of openness on economic growth was positive, and statistically significant in line with theoretical expectations.
Romer (1986), Lucas (1988), Dollar(1992), Baro, Sallai, Martin(1995), Edward (1992,1998) all asserted that a positive relationship exists between trade openness and economic growth.
Conversely, Levine and Reneth (1992), Harrison (1996), Rodriguez and Rodink (1996) took an opposite position that a negative relationship exists between trade openness and economic growth.
In Nigeria, there are also works on trade openness and economic growth with researchers taking different stance and sides in the discourse.
Kalu and Agodi (2015) examined whether trade openness makes sense, using Nigeria trade policy as yardstick. The study employed Autoregressive Conditional Heteroscedasticity (ARCH), Generalized Autoregressive Conditional Heteroscedasticity (GARCH) and Pairwise-Granger causality methodology using secondary data from 1984 to 2013. Results show that trade Adelowokan and Maku (2013) examined the effect of trade and financial investment openness on economic growth in Nigeria between 1960 and 2011. dynamic regression model was used and it indicated that trade openness and foreign investment exert positive and negative effect on economic growth respectively. The study further found a long-run relationship among trade openness, foreign investment, and economic growth in Nigeria within the period under study.
Eleanya et.al (2013) examined the possibility of a causal relationship between trade openness and economic growth in Nigeria in the pre and post SAP (1970Q1-1985Q4 and 1986-2011) periods using Augmented-Dickey Fuller and Phillips-Perron tests for unit root and Engle-Granger approach for cointegration. The results of the Cointegration test confirm that longrun relationship exist between economic growth and its determinants: trade openness, investment, and government expenditure respectively. The study is a departure from previous studies by making inter-period analyses. Engle-Granger Pair wise Causality Test was employed to test the direction of causality. A unidirectional causality ranging from economic growth to openness without a feedback in the pre SAP period (growth-led trade), whereas there exists a bi-directional causality going from economic growth to openness with a feedback effect in the post SAP period (growth-led trade and trade-led growth respectively).
This work would fill a knowledge gap by using more up to date dataset and using more vigorous diagnostics tests which would ensure that the used model is stable and the results reliable. Data characteristics consistent with time series properties will be ensured and certified with the view to ensuring that spurious results are not arrived at.
4. III.
5. Methodology
This study adopts the ex post facto research method which is a very common and ideal method in conducting research in business and social sciences. It is mostly used when it is not possible or acceptable to manipulate the characteristics of the variables under study.
Simon and Goes (2013) sees ex post facto research as one which is based on a fact or event that has already happened and at the same time employs the investigation and basic logic of enquiry like the experimental method.
As for this work, there are two key reasons for the choice of the ex post facto method. Firstly, the data is primary and is collected from the Central Bank of Nigeria sources. The data-set captures already computed and reported macroeconomic variables. Secondly, the reported figures or proxies for the variables of interest are not susceptible to the manipulations or doctoring of the researcher because they are information in public domain and are easily verifiable.
The data to be used for this work is purely secondary data as it will be drawn from published works. Annual time series data obtained from the Central Bank of Nigeria annual report from 1991 to 2013 formed the basis for the empirical analyses of this work. The a priori expectation of the co-efficients in the model is B 1, B 2 > 0, B 3 < 0.
6. Î?"GDP
The method of estimation is basically the Ordinary Least Square Method (OLSM). Joint Unit Test will be used for all the variables to confirm stationarity. Other diagnostic tests will be done which will include:
? White test for heteroscedasticity (WGH) to indicate any possible violation of the homoscedasticity assumption of Classical Linear Regression Model (CLRM).
? Breusch Godfrey LM serial correlation test. This is based on the fact that there are inherent limitations in the use of DW-statistic which the OLS reports.
? Ramsey Reset Test for Model Stability. This is to check for any misspecification error in the model, omission of any important variables and other functional defect in the model.
? The Recursive Estimate Graph will also be used to confirm whether the model is blue and within bounds. Source: Authors' Computation
7. IV. Data Analysis and Interpretation of Results
The descriptive statistics in Table 1 above, shows the basic aggregative averages like mean, median and mode for all the observations at differenced series. The spread and variations in the series are also indicated using the standard deviation. Significantly kurtosis which shows the degree of peakedness is also shown together with skewness which is a reflection of the degree of or departure from symmetry of the given series. From the table above, the Jacque Bera Statistics which is a test for normality shows that all the distributions are playtykurtic since their kurtosis are all less than two and the p values of the JB Statistics in all the instances are greater than 5%. This suggests a departure from normality. This is consistent with behaviour economic and financial time series. From the Figure 1 above, the variable that has the highest peak is export and the data also shows that export has the observation with the highest value. The plot also shows that the variables fall with a range. There are no much extreme and low values which makes the study of a possible linear association plausible Test for Unit Root A group unit root test was conducted for the variables. The results as presented below indicates that the series requires two differencing to achieve stationarity and are cointegrated of the same order. This is why the OLS was run on the second differenced series. makes us reject null and accept alternative that there is no unit root at second difference. This shows that the variables are jointly and severally order 2 variables. From the summary of the estimated results above (Table 3) the relationship between trade openness and economic growth in Nigeria within the sample period and the scope of the formulated model has been tested.
A positive and significant relationship was found out between Î?"GDP and Î?"NEXP and Î?"XP. This is consistent with apriori expectation. However, a positive but non-significant relationship was found between Î?"MP and Î?"GDP. This is a departure from our expected sign and direction. The R 2 which is explains that 97.7% of variation in GDP within the context of this model is explained by regressors. The Adjusted R 2 is 97.4%, this shows that there is a goodness of fit in the model. Unexplained variation is less than 3%.
The F-test 428.8974(0.0000*) shows that the overall regression is statistically significant at 5% level of significance. This evidences the fact that the overall regression can be used for meaningful analyses. Additionally, the DW statistics which is 1.58 approximately 2, by rule of thumb, rules out the suspicion of AR(1) autocorrelation and proves that the data used for the analyses is well behaved. The result of the DW statistic is to be taken with caution as it cannot detect higher order autocorrelation. We conducted a further confirmatory test for autocorrelation. The Breusch Godfrey LM serial correlation Test was used as a validity test for the DW statistics. The result of the BG LM serial correlation test done with a lag of 6 which by rule of thumb represents one-third of the number of observations indicates that the pvalues of the F and Chi-square tests are all greater than 5%. This means that we accept the null hypothesis of no autocorrelation and reject the alternative hypothesis. This confirms the DW results and absolves the regression results of all forms of spuriousness. The results of the White Test for heteroskedasticity as shown by the table above could not allow us accept the null hypothesis of homoscedasticity. To remedy this problem which is a clear violation of one of the cardinal assumptions of the Linear Regression Model, we used in the regression as reported in Table 5, the white heteroskedasticityconsistent standard errors and covariance. This gives us a more robust standard error and t-estimates as reported above.
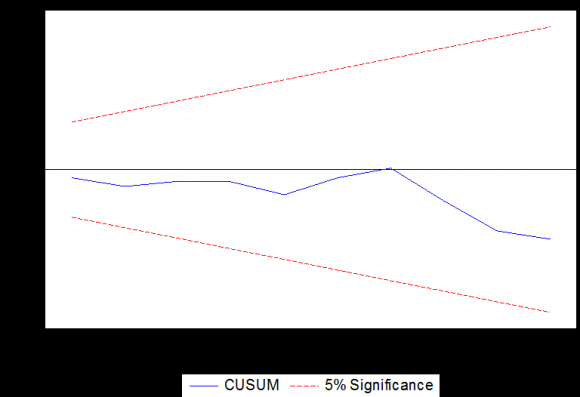
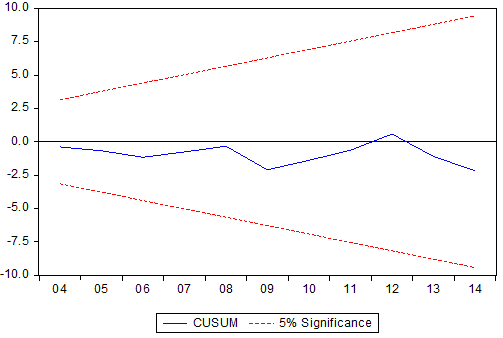
8. Test for model Stability
To confirm the stability of the model over the sample period and the absence of wrong functional form and model specification error, we used Ramsey RESET (Regression Specification Error Test) and the Recursive Estimates Bound Graph. The recursive graph shows the two red lines which are the upper and lower bounds and the blue line which is the model. This indicates that the model is blue and within bounds. The Ramsey RESET test as shown in Table 6 below, conducted on a lag of 2, shows that there is no model specification error. Indicating that irrelevant variables were not included and essential variables were not omitted.
9. Summary Recommendation and Conclusion
This paper analyses the relationship between trade openness and economic growth with emphasis on the Nigerian economy using a dataset covering a 23year period. The ordinary Least Square Regression method represents the principal method of estimation combined with an array of other general/standard and diagnostic tests. The motivation is to evaluate whether there is a significant contribution from trade openness proxied by net export (NEXP) to economic growth in Nigeria (GDP). The R 2 explains that 97.7% of variation in GDP in the model is explained by the principal explanatory variable NEXP and MP (import) and XP(export) which were used mainly as control variables or moderators. Export was found to be a positive and significant function of GDP but Import was positive and non-significant. This is consistent with theory as economies grow from exporting more than they import all things being equal. This is truer in Nigerian context where the monocultural nature of the economy has mostly made it over-reliant on imported goods.
There is therefore a strong recommendation and advocacy for all-round export promotion especially now that there is a strong need for changing the economy from its overdependence on foreign products.

| DMP | DGDP | DNEXP | DXP | |
| Mean | 3137308. | 13860.46 | 2122441. | 5257504. |
| Median | 2033640. | 6075.400 | 923879.0 | 2516805. |
| Maximum | 10235174 | 42396.80 | 6033405. | 14841508 |
| Minimum | 143151.2 | 532.6000 | -336057.6 | 205611.7 |
| Std. Dev. | 3148479. | 14209.48 | 2221720. | 5181729. |
| Skewness | 1.080367 | 0.844572 | 0.477932 | 0.756674 |
| Kurtosis | 2.873478 | 2.280772 | 1.642097 | 2.155382 |
| Jarque-Bera | 4.294379 | 3.089618 | 2.527777 | 2.753304 |
| Probability | 0.116812 | 0.213353 | 0.282553 | 0.252422 |
| Sum | 69020774 | 304930.1 | 46693696 | 1.16E+08 |
| Sum Sq. Dev. | 2.08E+14 | 4.24E+09 | 1.04E+14 | 5.64E+14 |
| Observations | 22 | 22 | 22 | 22 |
| Group unit root test: Summary | ||||
| Series: DGDP, DMP, DNEXP, DXP | ||||
| Date: 07/04/15 Time: 10:48 | ||||
| Sample: 1991 2013 | ||||
| Exogenous variables: Individual effects | ||||
| Automatic selection of maximum lags | ||||
| Automatic lag length selection based on SIC: 0 to 4 | ||||
| Newey-West automatic bandwidth selection and Bartlett kernel | ||||
| Cross- | ||||
| Method | Statistic | Prob.** | sections Obs | |
| Null: Unit root (assumes common unit root process) | ||||
| Levin, Lin & Chu t* | -5.42313 0.0000 | 4 | 68 | |
| Null: Unit root (assumes individual unit root process) | ||||
| Im, Pesaran and Shin W-stat -5.66042 0.0000 | 4 | 68 | ||
| ADF -Fisher Chi-square | 48.9229 | 0.0000 | 4 | 68 |
| PP -Fisher Chi-square | 412.420 | 0.0000 | 4 | 76 |
| Dependent Variable: Î?"GDP | |||||
| Included observation: 23 | |||||
| Option in OLS: White Heteroskedasticity Consistent Errors and | |||||
| Covariance | |||||
| Variables | Expectation | Coefficient | Std Error | t-statistics | P-value |
| Î?"NEXP | + | 0.002199 | 0.000322 | 6.825148 | 0.0000* |
| Î?"MP | - | 0.0388775 | 0.219670 | 1.769812 | 0.0920 |
| Î?"EXP | + | 0.667538 | 0.203542 | 3.279601 | 0.00370* |
| Other OLS Estimates | |||||
| R 2 97.72%, Adjusted R 2 97.4%, | |||||
| F-Statistic 428.8974 | |||||
| Prob(F-Statistic) 0.000000 | |||||
| (DW Stat 1.58) | |||||
| Note: In the stated Probability values * means significance at 5% level of significance | |||||
| Source: Authors Computation | |||||
| Breusch-Godfrey Serial Correlation LM Test: | |||
| F-statistic | 2.162739 | Prob. F(6,12) | 0.1204 |
| Obs*R-squared | 11.43004 | Prob. Chi-Square(6) | 0.0760 |
| Source: Authors' Computation | |||
| Heteroskedasticity Test: White | |||
| F-statistic | 10.92704 | Prob. F(6,15) | 0.0001 |
| Obs*R-squared | 17.90379 | Prob. Chi-Square(6) | 0.0065 |
| Scaled explained SS | 24.24542 | Prob. Chi-Square(6) | 0.0005 |
| Source: Authors' Computation |
| Ramsey RESET Test | |||
| Equation: UNTITLED | |||
| Specification: DGDP C DXP DMP DNEXP | |||
| Omitted Variables: Powers of fitted values from 2 to 3 | |||
| Value | Df | Probability | |
| F-statistic | 2.807097 | (2, 16) | 0.0902 |
| Likelihood ratio | 8.616753 | 2 | 0.0666 |
| Source: Authors' Computation | |||
| V. | |||