1. Introduction
inancial statement analysis significantly affects the business decision making. In the modern era of globalization and competitive work environment, if business wants to be successful then it is essential to be aware of the financial performance of the business. Ratio analysis is one of the relevant exercise that will give the idea about the secured future of the business. According to third edition of Oxford University ratio analysis or financial statement analysis is directly proportional to assess the business performance in financial terms (Nwakanma, 2008). Business strength and weaknesses are best identified with the help of deep analysis of financial statements (Babatunde, 2002). This paper explore the impact of liquidity and leverage on the profitability of the conventional banks of Pakistan.
Liquidity and leverage are the two basic measures that in glance gives the idea of banks financial performance, position and the adequacy of their resources. According to Ibenta, the firm's ability to meet its short-term maturing obligations is known as liquidity. Thus financial health is best described by the measurement of profitability, liquidity and leverage relationship (Ibenta, 2005).Today this is a need of every business to keep the bird eye view on each and every minute factor in order to remain stable and successful in the market. Banking sector plays a critical role in the development and growth of economy. In the context of Pakistan, banking sector is one of the biggest employer so it seems to be very important to study its financial structure in detail. No comprehensive study has been carried out for the measurement of the efficiency of conventional banks in Pakistan.
From the last decade, banking system in Pakistan has developed a lot. Muslim commercial Bank, faysal bank and alfalah bank has been taken as the sample for this study. MCB and Faysal bank are the leading banks in Pakistan. Whereas the bank Alfalah is the most significant bank in terms of growth. Faysal bank has more than 270 branches in 80 cities and its footprints are spreading day by day. It has assets of more than PKR 350 Billion. Bank Alfalah is the sixth largest bank in Pakistan having more than 500 branches in more than 170 cities in Pakistan. MCB is the most leading bank in Pakistan having the network of 1200 branches.
This paper will help banks to forestall the future financial quagmire and take the proactive actions in order to maintain the continuous development and growth. Being a biggest employer of the country, it is the responsibility of this sector to remain its business solvent and profitable and this paper will definitely help and open the doors of improvement, this paper depicts the past performance of the banks and also give viable and practical implications for the future growth and development. Due to economic instability it is very essential for the banks to have the idea about the optimal utilization of resources. So the financial ratios allows us for the temporal and cross sectional comparison. Thus, this study aims at determining the impact of leverage and liquidity on profitability and will suggest how to continue or improve the financial structure of the banking sector.
This paper comprises of four sections. First section consists of literature review, second describes the methodology while the third and fourth comprises of data analysis and conclusion respectively.
2. II.
3. Literature Review
Eljelly says that to reduce the business risk and unrequired investment in assets, an organization should be able to calculate and forecast its working capital. Moreover author says it is also important to meet short term business commitments (Eljelly, 2004).
According to International Accounting Standards (IFRS, 2006), liquidity is available cash to meet near future activities after deducting the financial obligation for that specific period (Reham, 2011). Liquidity risk indicates the situation of the organization where it will not be able to make any payment to its creditors. This is as the result of change in the proportion of long term credit and short term credit plus non-correlation with the structure of liability of that organization (Stoica, 2000). Different researchers of many universities say the liquidity required rate of each organization or business depends upon its financial position (D. . To find out the liquidity position of the business, special importance is held by the way which any organization is divided which are its assets and liabilities (D.Manzler, liquidity risk and the closed-end fund discount, 2004). Liquidity risk for any business is considered to be one the biggest risk, but it is matter of extreme liquidity, "security cushion" or the specialty of mobilizing capital at a "normal" cost (DEDU, 2009).
According to Morris and Shin "realizable cash on the balance sheet to short term liabilities". In this definition a term "realizable cash" is used this term mean short term asset and also other assets to which haircut has been applied (Morris, 2010). George H.Pink, G. Mark Holmes explained that ratio analysis helps to know the financial position of the company. (George H. Pink, 2005). Liquidity of the company is calculated by dividing its short term assets to its short term liabilities. Liquidity of the company shows the amount available to the business to invest in the business and also for the expenses of the company. It also show the amount available to meet long term and short term liabilities (Ross, 1977). A firm which own some extra amount of short term assets can increase the chance of internal funding which will further result in relationship between leverage and liquidity (S. Myers, 1977) (Bhunia, 2012) (Qureshi, 2012). A reasonable liquidity position has an impact on the financial position of the business (Zhao Bei, 2012) Many studies have proven a statistical relationship between leverage and liquidity (Harris, 1991) (Al-Najjar, 2011) (Al-Najjar B. T., 2008) (Eriotis N, 2007) ) .
According to Archer and D' Ambrosio "The more the amount of fixed costs to total costs the more the operating leverage of the firm". (ARCHER, 1972) Schultz and Schultz said that, "as a fixed expense is compared with an amount which is a function of a fluctuating base (sales), profit-and-loss results will not accept an in proportion relationship to that base. These results in fact will be subject enlargement, the degree of which depends on the relative size of fixed costs vis-avis the potential range of sales volume. This is commonly known as operating leverage." (Schultz, 1972).
Weston and Brigham explained to the business world that if the total fixed cost of the business will increase than the variable cost will be decreased which will also change the percentage of the profit of the firm, it can be increased and decreased (Brigham, 1969). Luoma and Spiller explain the financial leverage in the term of accounting. Financial leverage where increase the business's risk at the same time also increase the profit of shareholders (Luoma, 2002). The financial leverage which a firm employed may earn more on fixed cost than short term cost (Pandey, 2007). No noticeable relationship is found between cost of capital and financial leverage (Bhayani J Sanjay, 2009). A firms can use economic tools (borrowed funds) to finance a particular business project or to invest in company's assets. (Awan, Feb. 2014) The total return on company's total assets is considered to the profit the company. According to pecking-order theory the companies who are earning high profit will reduce the external funding, this will show the creditors that they have low rate to being bad debts. ( (Abor, 2005). Furthermore profitable companies does not provide complete information to its creditors or to whom they will pay the interest and investors (Myers, 1984); ; ). Yes there is a relationship between leverage and profitability (John, 1985); ; (Tong, 2005)(Al-Najjar B. T., The relationship between capital structure and ownership structure: new evidence from Jordanian panel data, 2008); (Mazur, 2007).
Profit and liquidity are really important components of any business. This is not possible for any firm to survive without liquidity. A business who is not earning profit but reaching its breakeven point can survive in the market for years but a business who is not maintaining its liquidity position will not survive for even short period of time. So even by observing the management of the liquidity a firm's future performance can be judged. (Bardia, 2004).
There is positive relationship between financial leverage and the profitability of any business. But there is no study held, on the relationship between cost of capital and financial leverage (Bhayani, 2006).
4. III.
5. Methodology a) Research design i. Purpose of study
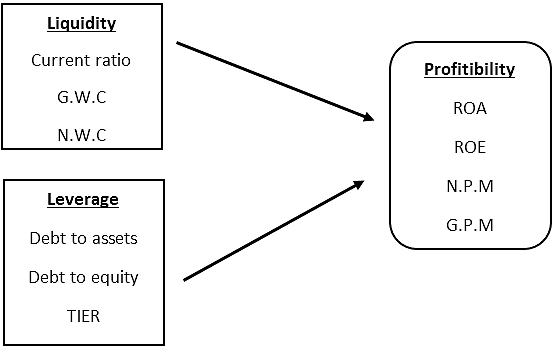
The purpose of this study is the hypothesis testing and prediction of the relationships of two independent variables (liquidity and leverage) on a dependent variable (profitability).
ii. Type of investigation It is a correlational study finding out the answer of whether the variables are related or not.
iii. Extent of researcher interference This involves minimal interference of the researcher as there is no manipulation in the research.
iv.
6. Study setting
The study setting is non-contrived and natural as it is done on a secondary data takes form the bank's financial statements.
7. v. Unit of analysis
Organizations are taken as the unit of analysis in this research to find out the relationship of leverage and liquidity on profitability.
vi. Time horizon This is a cross-sectional study in which only one time data is taken. There is no manipulation to find out the before and after results as it is done in a natural environment.
8. vii. Sampling technique
This research is done on the public limited conventional banks as their availability of financial reports is easy through their websites. For sampling techniques, convenient sampling has been adopted for the collection of data. One bank MCB (one of the pioneer bank in Pakistan formed in 1947) privatized in 1993 and two other private banks: Bank Alfalah incorporated in 1992 and Fysal Bank incorporated in 1994 was selected for the study.
9. Sample size:
10 year data of Faysal Bank, MCB and Alfalah Bank of Pakistan. H3a: Debt to assets is positively associated with profitability H3b: Debt to equity is positively associated with profitability H3c: Times interest ratio is positively associated with profitability iv. H4: Leverage is negatively associated with the bank's profitability H4a: Debt to assets is negatively associated with profitability H4b: Debt to equity is negatively associated with profitability H4c: Times interest ratio is negatively associated with profitability c) Operational Definitions i. Liquidity ratios Liquidity ratios of a company is used for measuring the ability to honor its (current and short term) obligations for a year. It measures the aptitude of a company to speedily convert current assets into cash. Liquidity is important factor to study because it is said that profitability and liquidity is achieved on the expense on each other.
ii. Current ratio It shows the ability of company to pay its current liabilities from its current assets and is used for quick measurement of the liquidity of a company. Formula: Current Assets ÷ Current liabilities iii.
10. Gross working capital
Gross working capital is the amount of total current assets of the company which is important to know by the analysts and the creditors which shows the amount the business will recover within one year. Formula: Gross working capital = All current assets iv. Net working capital Net working capital is the figure used to calculate the short term liquidity position of a company. It is important to know for maintaining a balance between the current assets and current liabilities.
Formula: Net working capital = Current assets -Current liability v. Leverage ratios Leverage ratios tells about the capital structure specifically the liability portion of the company in a year and its effect on the income of that company. This over all depicts the company's flexibility in paying its due debts of the year which gives a major indication to the investors interested to invest in the company.
11. vi. Debt to Assets
This ratio gives an indication of the risk involved in increasing or decreasing its creditor's investment and the equity investment of the company. It tells the company's liabilities position and burden to meet its obligations.
12. Formula: Total liabilities ÷ Total assets vii. Debt to Equity
This ratio is used in finding out the proportion of company's creditors in relation to the owners (common shareholders) of the company. It calculates how low is this ratio which would be preferable by the investors in the market. And how high the ratio is which can violate the incomes because of high interest expense on the liabilities.
Formula: Total liabilities ÷ Total common stock equity
13. viii. Times Interest Earned Ratio (TIER)
The ratio tells about the interest payment made by the company with its earnings before interest and taxes. It indicates that how many times the company can pay its finance cost with its one year EBIT.
14. ix. Profitability
The profitability ratios are used to measure the operating efficiency of a company and the rate of generation of profit by the company.
15. x. Return on asset
This is the major profitability ratio that shows the efficient use of assets by the organization.
Formula: ROA = (Net Income + Interest Expense) ÷ (Average Assets during the period) (OR) Net profit margin × total asset turnover
16. xi. Return on equity
This ratio of profitability is used to measure the productivity of equity and indicator of the ability to attract capital from the investors. Formula: Net income ÷ shareholder's equity
17. xii. Net profit margin
Net profit margin is an important tool for measuring net income on each unit of sales which tells the company's performance of the year. On this figures he investors take decision to invest in that business or not.
Formula: Net profit ÷ total revenue
18. xiii. Gross profit margin
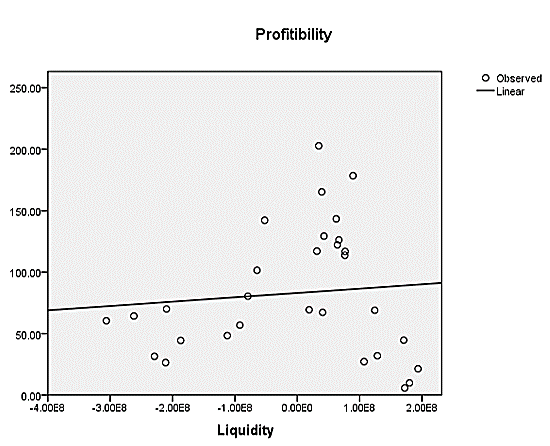
It is a tool to measure the manufacturing and distribution efficiency during the production process in a year. Higher percentage shows that the more company retains on each dollar of sales to service its other costs and obligations and it is better to control costs. Formula: Gross profit ÷ Total sales IV. In the above table correlation of the three variables under study are shown. Liquidity is an independent variable which is positively correlated 0.262 with leverage and insignificantly positively related 0.95 with profitability. Leverage is an independent variable which is positively related with liquidity and have significantly negative relation with profitability. Profitability which is the dependent variable is insignificantly positively related with liquidity and significantly negatively correlated with leverage. In the above table current ratio is negatively related with gross working capital, significant positively related with net working capital, negatively related with debt to asset ratio, negatively related with debt to equity ratio, positively related with times interest ratio and significant positively related with profitability. Gross working capital is negatively related with current ratio, positively related with net working capital, positively related with debt to asset ratio, significant positively related with debt to equity ratio, significant positively related with times interest earned ratio and significant negatively related with profitability. Net working capital is significant positively related with current ratio, positively related with gross working capital, negatively related with debt to asset ratio, negatively related with debt to equity ratio, positively related with times interest ratio and significantly positively related with profitability. Debt to asset ratio is negatively related with current ratio, positively related with gross working capital, negatively related with net working capital, significant positively related with debt to equity ratio, positively related with times interest earned ratio and negatively related with profitability. Debt to equity is negatively related with current ratio, significant positively related with gross working capital, negatively related with net working capital, significant positively related with debt to asset ratio, significant positively related with times interest earned ratio and significant negatively related with profitability. Times interest earned ratio is positively related with current ratio, significant positively related with gross working capital, positively related with net working capital, positively related with debt to asset ratio, significant positively related with debt to equity ratio and positively related with profitability. Profitability which is the dependent variable is significantly positively related with current ratio, significant negatively related with gross working capital, significantly positively related with net working capital, negatively related with debt to asset ratio, significantly negatively related with debt to equity ratio and positively related with times interest ratio. The above figure shows the regression line of profitability (dependent variable) with the independent variable (liquidity). It is having a positive and flat regression line that means profitability is slightly positively affected by liquidity.
19. Data Analysis
The above table shows than the constant term which is the intercept term is 165.745. This means that when the independent variables (liquidity and leverage) will be zero the value of independent variable (profitability) will be 165.745. The unstandardized coefficient of liquidity is very small which means that the effect of liquidity on profitability is very low and the unstandardized coefficient of leverage is negative with show that the leverage is effecting on the profitability is a negative manner. The standardized coefficients shows that the relatively highest influencing variable between the two independent variables is the leverage. That means if the bank wants to enhance its profitability it has to reduce its leverage.
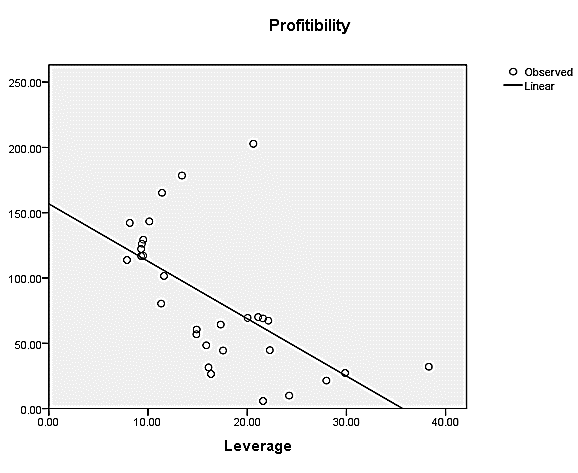
The above figure shows the regression line of profitability (dependent variable) and leverage (independent variable). The line plotted is negatively sloped and it is steeper than the liquidity regression line. It means that the leverage is significantly affecting the dependent variable: profitability. In the table given above, the correlation of liquidity and leverage with profitability is 66.60% and variance (R square) is 0.444 which indicates that the combined effect of liquidity and leverage on profitability is 44.4% whereas the exogenous variables impact on profitability 0.666 (1-0.444). Adjusted r-square is slightly lower than the R-square which shows that the result are more generalizable. Model summary shows that R, Rsquare and adjusted R-square are positively significant. The standard error of estimate is 40.496 which clearly indicates that observed values are distant from the regression line. In the above table, the first value of degree of freedom shows the number total independent variable which is 2. Second term 27 (N-K-1) is the total number of complete responses minus total number of independent variables minus 1. The F-value i.e. 10.785 is significant at 0.000 level.
V.
20. Conclusion
In our study, we took a sample of 3 conventional banks of Pakistan: one is one of the pioneer banks of Pakistan (MCB) which was privatized in 1993, other two are the newly formed private banks. The study had the observations of the variables under study over the period of 2005-2014 which makes a total of 10 years. Thus we have collected longitudinal data for a continuous examination of the banks' liquidity, leverage and profitability. The analysis performed for the research was correlation and regression. The study came to a conclusion that liquidity is insignificantly positively related with profitability and leverage is significantly negatively related with profitability.
Current ratio is significantly positively related with profitability. Gross working capital is significantly negatively related with profitability. Net working capital is significantly positively related with profitability. Debt to asset ratio negatively related with profitability. Debt to equity is significant negatively related with profitability. Times interest earned ratio is positively related with profitability.
The results proves that our null hypothesis is rejected that the two independent variables are not related to profitability. H1 is accepted that of Liquidity is positively associated with the bank's profitability. In its further parts hypothesis H1a and H1c is accepted that is current ratio and net working capital is positively associated with profitability. H2 is rejected as no negative relation is found between liquidity and profitability but the gross working capital is found negatively associated with profitability.
H3 is rejected as there is no positive relation between leverage and profitability but the times interest ratio is found positively associated with profitability. H4 is accepted because of a negative relation. But times interest ratio is not negatively associated with profitability.
21. VI. Limitation and Future Directives
This study has set some preliminaries in exploring the relationships of liquidity, leverage and profitability on Pakistani conventional banks. But a further detailed evaluation could can be done. New research can be done on larger number of conventional banks. Secondly the study of the same variables and their relationships can be done on Islamic Banks of Pakistan.
| N | Minimum | Maximum | Mean | Std. Deviation | |
| Liquidity | 30 | -3.06E8 | 1.94E8 | -2.8245E6 | 1.41950E8 |
| Leverage | 30 | 7.88 | 38.31 | 16.7895 | 7.28953 |
| Profitability | 30 | 5.79 | 202.76 | 82.9525 | 52.40911 |
| Valid N (list wise) | 30 | ||||
| Independent variables: Liquidity, Leverage | |||||
| Dependent variable: Profitability | |||||
| Liquidity | Leverage | Profitability |
| © 2016 Global Journals Inc. (US) |
| Model | R | R Square | Adjusted R Square | Std. Error of the |
| Estimate | ||||
| 1 | .666 a | .444 | .403 | 40.49658 |
| a. Predictors: (Constant), Leverage, Liquidity | ||||
| Model | Sum of Squares | df | Mean Square | F | Sig. | |
| 1 | Regression | 35375.468 | 2 | 17687.734 | 10.785 | .000 a |
| Residual | 44279.271 | 27 | 1639.973 | |||
| Total | 79654.739 | 29 | ||||
| a. Predictors: (Constant), Leverage, Liquidity | ||||||
| b. Dependent Variable: Profitability | ||||||