1. Introduction
iquidity and profitability has got tremendous importance in the corporate world. Liquidity refers to the management of current assets and current liabilities of a company. It plays key role in defining, whether a firm is able to effectively manage it short term obligations. Due to its dire importance it is important for firms to maintain a reasonable amount their assets in the form of cash in order to meet their short term obligations. Balanced liquidity level is necessary for the effectiveness and profitability of a firm. Therefore, firms need to determine the optimum level of the liquidity in order to ensure high profitability. Liquidity, should neither be too low nor too high. Rather, it should maintain a reasonable level. Whereas, profitability refers to the revenues earned by firms, against their operations and incurred expenses. In order to find the profitability level of firms, Profitability ratios are used, whereby it can clearly be examined that where the firm stands in terms of profitability. Enhancement of profitability is the ultimate purpose of every firm, and each of them strives to achieve optimum profitability. Since, there is a significant relationship between liquidity and profitability of the firm, so the firm is required to maintain optimum level of liquidity.
In today's developing and competitive world, banking sector has emerged as key player, and contributing its best to create employment, and improving the financial sector of the country. With the growing trend, it has become a challenge for the sector to earn maximum profitability. It has become necessary for firms to take dynamic decisions to effectively manage their assets. Due to this challenge followed by the growing trend, it has become necessary, that research based study should be conducted to investigate and recommend solutions that would help firms companies improve their profitability. With the same cited objective we are conducting this research.
Moreover, I have selected HBL for research, because of the fact that it is the largest commercial bank in Pakistan. Conducting research on this corporate giant, we would be able to deduce much. Authentic results that would easily be applicable on other commercial banks in Pakistan. It has largest number of employees and it requires high level of analysis to maintain optimum level of liquidity, in order to ensure high profitability. Moreover, the data of the bank are easily available and it publishes its annual reports on consistent bases. So, it is easy yet effective to choose this typical bank for our research.
2. II.
3. Literature Review
Liquidity plays vital role in determining the effectiveness of firms. Thus it is necessary for firms to maintain a balanced liquidity ratio in order to meet their short term liabilities. Due to its relationship with the day to day operations it is imperative for both internal and external analysts to study liquidity. (Bhunia, 2010). The purpose of liquidity management is maintain tradeoff between liquidity and profitability. (Rahemanet all, 2007).
Velnampy (2013) he also adds that importance of profitability does not mean that company the company that more liquidity is profitable. Don (2009), while comparing relative importance of both states that liquidity is more important than profitability, because it determines the survival of the company. Eljelly, 2004) found that there is significant negative relationship between the firm's profitability and liquidity when it is measured by current ratio. The study also found that at industry level, however, cash gap is important to measure the liquidity than current ratio that affects profitability.
A research study conducted by Bardia ( 2004) and Sur and Ganguly (2001) on steel giants SAIL and aluminum producing industry reveal that liquidity and profitability are positively related with each other.
Qasim Saleem & Ramiz Ur Rehman (2011) by taking five years data of twenty six enterprises examined the relationship between liquidity of firm and profitability, found that there is positive relationship between firm's liquidity and profitability.
A research conducted by Wang (2002) reveals that there is a positive relationship between liquidity and operating performance. Seventeen years data of sample firms was taken. They examined the association between profitability and the information system taking the sample. Mean while the research also reveals that there is positive relationship between liquidity and profitability. A research undertaken by (Zhang, 2011) suggests that there is significant positive relationship between firm's liquidity and profitability.
4. III.
5. Methology a) Data Source
The data for this research has been collected from the annual financial reports of the respective companies. The required ratios were extracted from the consolidated financial statements of the bank.
6. b) Sample size
Data of a prominent commercial bank in Pakistan has been taken as sample, and five years data of the respective banks have been used for analysis.
7. c) Mode of analysis
Standard regression and correlation were run on Statistical Package for Social Sciences (SPSS), to find the nature and strength of relationship between the two variables. In the analysis liquidity was taken as independent variable whereas profitability was taken as dependent variable.
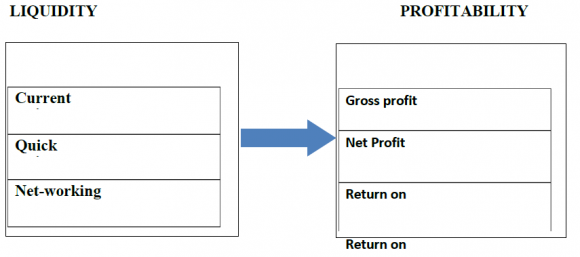
8. Conceptual Framework d) Hypothesis
Following hypothesis are taken as base for the analysis, in find the relationship between liquidity and profitability.
9. First hypothesis H0: There is no relationship between liquidity and profitability
H1: There is a relationship between liquidity and profitability Second Hypothesis H0: Liquidity and profitability does not affect each other
10. H1: Liquidity and profitability affect each other
In order to test the first hypothesis correlation will be used, whereas to test the second hypothesis we will use standard regression Third Hypothesis H0: there is a positive relationship between current ratio and overall profitability. H1: There is a negative relationship between current ratio and overall profitability.
Fourth Hypothesis H0: There is a positive relationship between quick ratio and profitability. H1: There is a negative relationship between quick ratio and profitability Fifth Hypothesis H0: There is a positive relationship between current ratio and Net Profit Margin H1: There is a negative relationship between current ratio and Net Profit Margin Sixth Hypothesis H0: There is a positive relationship between quick ratio and Net Profit Margin. H1: There is a negative relationship between quick ratio and Net Profit Margin.
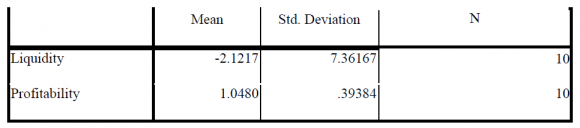
Seventh Hypothesis H0: There is a positive relationship between current ratio and Gross Profit Margin H1: There is a negative relationship between current ratio and Gross Profit Margin Eighth Hypothesis H0: There is a positive relationship between quick ratio and Gross Profit Margin H1: There is a negative relationship between quick ratio and Gross Profit Margin IV. The descriptive statistics of the research show that gross profit margin and profitability has highest average value, where as current ratio has the lowest average value. Moreover, it also shows that the difference between the minimum and maximum values of profitability stood at highest thus giving it the highest. Whereas lowest range was of gross profit margin. Moreover, Standard deviation of profitability is also highest among all other, showing the maximum deviation of the data from its mean.
11. Analysis a) Discriptive Statistics
12. Liquidity and profitability affect teach other Accepted Regression H0
13. There is a positive relationship between current ratio and overall profitability Accepted Correlation
14. H1
15. There is a negative relationship between current ratio and overall profitability
Rejected Correlation H0
16. There is a positive relationship between quick ratio and profitability Accepted Correlation
17. H1
18. There is a negative relationship between quick ratio and profitability
Rejected Correlation H0
19. There is a positive relationship between current ratio and Net Profit Margin Accepted Correlation
20. H1
21. There is a negative relationship between current ratio and Net Profit Margin
Rejected Correlation H0
22. There is a positive relationship between quick ratio and Net Profit Margin Accepted Correlation
23. H1
24. There is a negative relationship between quick ratio and Net Profit Margin
25. H0
26. There is a positive relationship between current ratio and Gross Profit Margin Accepted Correlation
27. H1
There is a negative relationship between current ratio and Gross Profit Margin Rejected Correlation The above model summary of regression analysis shows that liquidity significantly affects the profitability of the commercial bank. It also reveals that there is a very strong direct relationship between liquidity and profitability.
The above curve drawn to show relationship between profitability and liquidity shows that there is a positive relationship between Liquidity and profitability. As shown the graph with increase in Liquidity, profitability also increases.
28. V.
29. Conclusion & Recommendations
It has been empirically proved through analysis that liquidity has positive relationship with profitability, and has considerable impact on the profitability of commercial banks in Pakistan. With the growing liquidity level to acertain limit the profitability also increases. None of the variable shows negative relationship. Every ratio of liquidity shows positive relation with all the ratios of liquidity. Hence, this research indicates that liquidity has positive relationship with profitability. Therefore, it is suggested that banks should keep considerable amount of their liquid assets in order to get higher rate of profit.
30. VI.
31. Limitations
This research has been conducted, only by getting five years data of a popular commercial bank (Habib Bank Limited) in Pakistan. Hence it cannot be generalized to other smaller sized banks like DFIs. Moreover, to make the findings more generalizable, the sample size can be increased and the numbers of years for data collection may also be increased. Moreover to make the research more reliable data of some other leading commercial banks can also be brought to analysis, so that the findings will be reliable coupled with being generalizable. Since, in this research only regression and correlation analysis has been used.

| N | Minimum | Maximum | Mean | Std. Deviation | |
| Current Ratio | 5 | .88 | 1.35 | 1.0460 | .21267 |
| Quick Ratio | 5 | 1.15 | 2.25 | 1.5360 | .49531 |
| GPM | 5 | 4.70 | 17.38 | 9.1160 | 5.00421 |
| NPM | 5 | .86 | 8.90 | 3.3080 | 3.27085 |
| Profitability | 5 | 7.27 | 26.28 | 12.4240 | 7.85017 |
| Liquidity | 5 | 2.03 | 3.44 | 2.5820 | .68445 |
| Valid N (listwise) | 5 |
| NO | HYPOTHESIS | RESULT | TOOL |
| H0 | H0: There is no relationship between liquidity and profitability | Rejected | Correlation |
| H1 | There is a relationship between liquidity and profitability | Accepted | Correlation |
| H0 | Liquidity and profitability does not affect each other | Rejected | Regression |
| H1 |
| Current Ratio Quick Ratio | NPM | GPM | Profitability | Liquidity | |||||||
| Current Ratio Pearson Correlation | 1 | .844 | .749 | .620 | .707 | .922 | * | ||||
| Sig. (2- | .072 | .145 | .265 | .182 | .026 | ||||||
| tailed)N | 5 | 5 | 5 | 5 | 5 | 5 | |||||
| Quick Ratio Correlation | Pearson | .844 .072 | 1 | .283 .644 | .206 .739 | .250 .686 | ** .986 .002 | ||||
| Sig. (2- | 5 | 5 | 5 | 5 | 5 | 5 | |||||
| tailed)N | |||||||||||
| NPM | Pearson Correlation | .749 | .283 | 1 | .791 | .921 | * | .438 | |||
| Sig. (2-tailed) | .145 | .644 | .111 | .026 | .461 | ||||||
| N | 5 | 5 | 5 | 5 | 5 | 5 | |||||
| GPM | Pearson Correlation | .620 | .206 | .791 | 1 | .967 ** | .342 | ||||
| Sig. (2-tailed) | .265 | .739 | .111 | .007 | .573 | ||||||
| N | 5 | 5 | 5 | 5 | 5 | 5 | |||||
| Profitability Correlation | Pearson | .707 .182 | .250 .686 | .921 .026 * | ** .967 .007 | 1 | .400 .504 | ||||
| Sig. (2- | 5 | 5 | 5 | 5 | 5 | 5 | |||||
| tailed)N | |||||||||||
| Liquid ity | Pearson Correlation Sig. (2-tailed) | .026 | .922 | * | ** .986 .002 | .438 .461 | .342 .573 | .400 .504 | 1 | ||
| N | 5 | 5 | 5 | 5 | 5 | 5 | |||||
| *. Correlation is significant at the 0.05 level (2-tailed) | |||||||||||
| Impact of Liquidity on Profitability of Commercial Banks in Pakistan: An Analysis on Banking Sector in | |||||||||
| Pakistan | |||||||||
| 2016 | |||||||||
| Year | |||||||||
| 56 | |||||||||
| Volume XVI Issue I Version I | |||||||||
| ( ) C | |||||||||
| Global Journal of Management and Business Research | Current Ratio Pearson Correlation Sig. (2-tailed)N Quick Ratio Pearson Correlation Sig. (2- | Current Ratio Quick Ratio 1 .844 .072 5 5 .844 1 .072 | 5 | NPM .749 .145 .283 .644 | GPM .620 .265 5 .206 .739 | Profitability .707 .182 5 .250 .686 | Liquidity .922 * .026 5 .986 ** .002 | ||
| tailed)N | 5 | 5 | 5 | 5 | 5 | 5 | |||
| NP M | Pearson Correlation Sig. (2-tailed) | .749 .145 | .283 .644 | 1 | .791 .111 | * .026 .921 | .438 .461 | ||
| N | 5 | 5 | 5 | 5 | 5 | 5 | |||
| © 2 16 Global Journals Inc. (US) | |||||||||