1. Introduction
he effects of marketing strategies on the creation/building and management of consumerbased brand equity should be critically investigated and measured to know the return on marketing investments/marketing efforts productivity and to maintain the health of brand in the minds of consumer. Aaker (1991) claimed consumer-based brand equity dimensions have affected by a variety of marketing strategies like marketing communication strategies. Keller (2003) has also noted that the added value of the brand is the result of marketing strategies. Accordingly, companies designed different marketing strategies like marketing communication strategies and invest a huge amount of money to create and manage consumer-based brand equity in order to take the advantages from the concept because consumer-based brand equity is an ideal indicator of the performance of long-term marketing investments and an ideal goal to enhance sales and profits simultaneously (Baldinger, 1992).
Studies indicated that the individual contribution of marketing efforts like advertising spending intensity and event sponsorship on brand equity is unclear (Chu & Keh, 2006), and scholars have highlighted the need to examine the effects of these variables on the creation and management of brand equity (Netemeyer, et al., 2004). Besides, researchers vary in their opinions and attitudes towards marketing activities effect on brand equity (Dawar & Parker, 1994). Furthermore, marketing practitioners face a great challenge in deciding the optimal marketing budget to the highest impact on the target market (Soberman, 2009) and the brand (Ataman, Van Heerde, & Mela, 2010). Thus, this study helped to have a better understanding on the role of marketing communication efforts on the creation and management of consumer-based brand equity.
In the last 30 decades, a growing amount of attention has been devoted by academics and practitioners to the conceptualization, creating/building, measurement and management of brand equity (Aaker, 1991(Aaker, , 1996;; Aaker & Keller, 1990;Keller K. L., 1993,1998; Ailawadi, Donald, & Scott, 2003;Netemeyer, et al., 2004;Erdem, Swait, & Valenzuela, 2006), all come up with several often divergent viewpints on the content and meaning of brand equity (Vazquez, Del Rio, & Iglesias, 2002); the dimensions of brand equity; the factors that influence it; the perspectives from which it should be measured; and the way to measure it (Ailawadi, Donald, & Scott, 2003;Keller K. , 2003). Barwise (1993) also stated, even if the concept attracts many researchers, little conceptual development or empirical research has addressed which marketing activity builds brand equity. However, there is a general agreement that brand equity should be defined and measured in terms of marketing effects that can uniquely attributed to a brand (Keller,2003). All these issues motivated the resercher to contribute something to the academic world by undertaking a study on the developing market (Ethiopia) by considering beer as a prodcut category.
Furthermore, there is very little work concentrating on systematic investigations of the effects brand equity in brewery industry. Still, most of previous brand equity studies were conduct in Europe, USA and some part of Asia, even if they were conduct in other disciplines; their findings might not be generalized in the Ethiopian market without empirical testing. Dawer and Parker (1994) supported this idea by stated consumers in different part of the world's vary in their perception, attitude and behavior towards a certain marketing practices. The main purpose of this study is to examine the effects of advertising spending and event sponsorship on brand equity.
2. II.
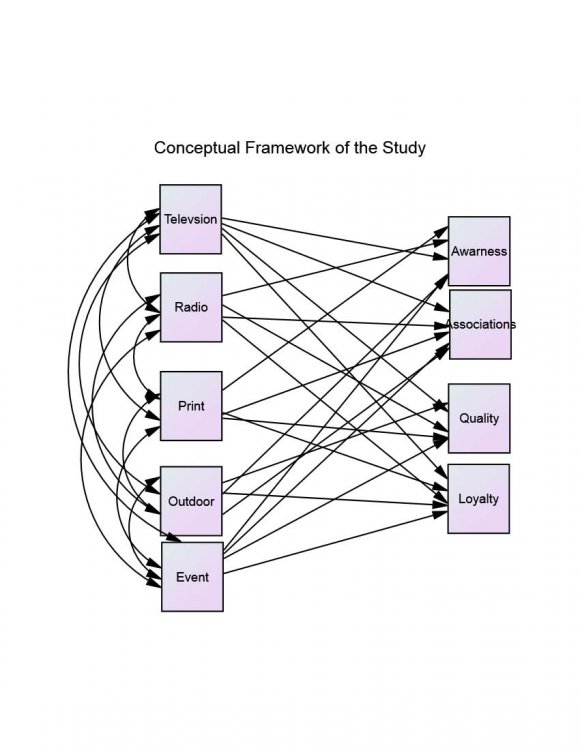
Literature Review Aaker (1991) was expanded and used in the present study. Besides, the effects of selected marketing activities on the dimensions of consume-based brand equity were also investigated by . Hence, by adapted and extended Aaker (1991) and works, the current study examined the effects of advertising spending and event sponsorship on brand equity. Aaker (1991Aaker ( , 1996) ) provided one of the most generally accepted and comprehensive definition of brand equity (Buil, de Chernatony, & Martinez, 2008), defined brand equity as "a set of assets (and liabilities) linked to a brand's name and symbol that add to (or subtract from) the value provided by a product or service to a firm and/or that firm's customers." Besides, Keller (1993) defined brand equity by considering its impact on consumer perception and behavior, and defined brand equity as "the differential effect of brand knowledge on consumer response to the marketing of the brand". These two definitions are the pioneering brand equity definitions and the base for the brand researchers. Hence, the current study bases the explanation of Aaker and Keller.
Strong brand equity leads to create value to the firm through charging premium prices, increase customer demand, brand extension become easier, communication campaign become more effective, better trade leverage, margin can be greater, companies become less vulnerable to competitors, lower price elasticity, greater competitiveness, generates a higher purchase intentions, and ultimately, higher profits and market value (Cobb-Walgren, Ruble, & Donthu, 1995; Agres & Dubitsky, 1996;Graeff, 1997;Bendixen, Bukasa, & Abraat, 2003).
3. c) Perspectives Of Brand Equity
Brand researchers applied different perspectives/approaches to investigate brand equity (Kotler & Keller, 2006). The most common perspectives are financial and consumer-based brand equity perspectives (Srivastava & Shocker, 1991;Zarantonello & Schmitt, 2013). The financial-based perspective addresses the financial value of the brand and measures brand equity by calculating the net cash flows the brand created for the firm (Sequeira & Mohan, 2012). The consumer-based brand equity perspective on the other hand, focuses on the conceptualization and measurement of brand equity on individual consumer's context and consumer's response to brands and defines brand equity as the value of a brand to the consumers (Aaker D. A., 1991; Kamakura & Russell, 1991; Keller K. L., 2008). Hence, consumer based brand equity motivated the researcher to conduct a study in the Ethiopian brewery industry.
4. d) Conceptual Domain Of Consumer-Based Brand Equity
Consumer-based brand equity is the study of brand equity from the perspectives of consumer's (Xu & Chen, 2010). It occurs when customers are familiar with a brand and hold favorable, strong and unique brand associations in their memory (Kamakura & Russell, 1991;Wang, Wei, & Yu, 2008). The brand has value for the firm, retailers and investors if and only if the brand has value for the customers and the consumer perceives value in a brand (Cobb-Walgren, Ruble, & Donthu, 1995). Furthermore, conceptualizing brand equity from customer perspective is useful in designing guidelines for marketing strategies and tactics and suggests areas where research can be useful in assisting managerial decision-making (Sequeira & Mohan, 2012). Due to these, the study focused on consumer perspective of brand equity. Aaker (1991Aaker ( , 1996) ) conceptualized brand equity into five categories: perceived quality, brand loyalty, brand awareness, brand associations, and other proprietary brand assets. From these five brand equity dimensions, the first four represents customers' evaluations and reactions to the brand that can readily understood by consumers (Barwise, 1993;Yoo & Donthu, 2001). Therefore, the operationalization of consumer-based brand equity can be divided into consumer perceptions (brand awareness, brand associations, and perceived quality) and customer behavior (brand loyalty) (Kazemi, Hosseini, & Moradi, 2013). These dimensions have been commonly accepted and used by many reserchers (Keller, 1993
5. e) Brand Awareness
Brand awareness is the first and an important component of brand equity (Aaker, 1991;Tong & Hawley, 2009). Brand awareness refers to "the ability of potential buyers to recognize and recall brands as a member of a certain product category" (Aaker, 1991). Keller (1993Keller ( , 2003) also defined brand awareness as "the consumer's ability to identify the brand under different conditions". Collectively brand awareness can be grouped in to brand recall and recognition (Aaker, 1991;Keller, 1993;Rossiter & Percy, 1987; Liu, Liston-Heyes, & Ko, 2010). Hence, in the current study, brand awareness is conceptualized as consisting of both brand recall and brand recognition.
6. f) Brand Associations
Brand association is another important component of brand equity (Aaker, 1991;Keller, 1993). Brand association is "anything linked in memory to a brand" and "the meaning of the brand to the customer" (Aaker, 1991). Keller (1993) also defined brand associations as "an impression based on other information that is, related to impressions created by the brand in the minds of consumers and that includes the brand's meaning for the consumers". Those information held on consumer mind may affecting the consumer's buying decisions and they also may be the result of various marketing activities. A strong brand association can be viewed as "a sign of quality and commitment", "leading customers to familiarizes purchasers with a brand", as well as "helping them to consider it at the point of purchase" (Aaker D. A., 1991;Tong & Hawley, 2009;. The present study considered perceived value, brand personality and organizational associations as the three most important elements of brand associations affecting brand equity (Aaker, 1991(Aaker, , 1996;;Sequeira & Mohan, 2012).
7. g) Percived Quality
Perceived quality is another important dimension of brand equity (Farquhar, 1989;Aaker, 1991Aaker, ,1996) ) and marketers across all product categories have increasingly recognized the importance of perceived quality in brand decisions (Morton, 1994). Perceived quality refers to "the consumer's subjective judgment about a product's overall excellence or superiority" (Zeithaml, 1988). In this instance, quality is considered as consumer-based brand equity variables which integrate perceptions and experiences of a consumer (Mutsikiwa, Dhliwayo, & Basera, 2013). The consumer's opinion about the brand's quality and its attributes with respect to its expected performance forms the measurement scale indicator of the brad quality perceived by individuals (Villarejo-Ramos & Sanchez-Franco, 2005).
8. h) Brand Loyalty
Brand loyalty is the heart and the major component of brand equity and defined as the attcahement the customer has to a brand (Aaker, 1991). Developing and maintaining loyalty should be placed at the heart of marketing plans, especially in the face of highly competitive markets with increasing unpredictability and decreasing brand differentiation (Delgado-Ballester & Munuera-Aleman, 2001).
Brand loyalty is composed of two different components namely attitudinal (focusing on personal commitment to a set of unique values related to the brand) (Chaudhuri & Holbrook, 2001) and the tendency to be loyal to a brand (prioritizing the brand as the first choice for purchase) (Yoo & Donthu, 2001); and behavioral (focusing on product purchasing repetition or repeat buying behavior) (Dick & Basu, 1994; Taylor, Celuch, & Goodwin, 2004; Oliver R. L., 1999; Ehrenberg, Goodhardt, & Barwise, 1990). The present study conceptualize brand loyalty from attitudinal and behavioral perspectives.
9. i) The Effects of Advertising Spending On Brand Equity
Scholars indicated that advertising is a powerful way of communicating a brand's functional and emotional benefits and values (de Chernatony, 2006), and consumers' perception of advertising spending has a great effect on marketing success. When consumers' perceive high spending on advertising, it will increase their level of confidence in the brand (Kirmani & Wright, 1989). Besides, advertising researchers have found that advertising intensity is very successful in generating brand equity (Boulding, Eunkyu, & Richard, 1994) because the frequency within which a consumer sees the advertising affects the effectiveness of the communication tools (Batra, Myers, & Aaker, 1996;Kotler P. , 2000).
Aaker (1991) also indicated that brand equity is the long-term outcome of advertising spending. However, advertising spending may not always create brand equity. As Keller and Lehmann (2006) have stated that the amount of financial investment in marketing does not guarantee success in terms of brand equity creation. The main reason can be advertising spending may reach a saturation point, the erosion of traditional advertising and over advertising (Chu & Keh, 2006;Wang, Zhang, & Ouyang, 2009).
Advertising is defined in the current study as customer's perceptions about advertising spending intensity on television, radio, print and outdoor (Cobb-Walgren, Ruble, & Donthu, 1995; . Hence, the present study adapted exploratory approach and assumes consumers' perception of a brand's advertising spending on television, radio, print and outdoor has a positive influence on brand equity dimensions, thereby affecting the creation of consumerbased brand equity in the Ethiopia beer market. Accordingly, the study proposed the following relationships. Hypothesis 1: Consumers' perception of a brand's advertising (television, radio, print and outdoor) spending has a positive influence on brand equity dimensions.
10. j) The Effects of Event Sponsorship on Brand Equity
Marketing scholars have started to examine event sponsorship, part of event marketing, in terms of the persuasion process and the ability to positively affect the brand (Sneath, Finney, & Close, 2005; Martensen, Gronholdt, Bendtsen, & Jensen, 2007). To make sponsorship successful, marketers should chose appropriate events and the events must meet the marketing objectives and communication strategy defined for the market (Kotler & Keller, 2012). Research has suggested sponsorship is particularly useful in creating brand awareness and associations /image (Meenaghan T., 1996; Hoek, Gendall, Jeffcoat, & Orsman, 1997; Gwinner & Eaton, 1999). Besides, Cornwell (1995) and Bennett (1999) have indicated a significant effect of sponsorship on brand recall; Pham and Johar (2001) has indicated the significant effect of sponsorship on brand recognition; and Gwinner and Eaton (1999) have indicated the significant effect of sponsorship on brand image. Furthermore, Crimmins and Horn 1996) indicated event sponsorship may increase perceived brand superiority (Crimmins & Horn, 1996).
The study adopted the definitions proposed by Meenaghan, (1998), "sponsorship can be regarded as the provision of assistance either financial or in-kind to an activity by a commercial organization for the purpose of achieving commercial objective". Hence, the present study examined the impact of event sponsorship, part of event marketing, on the creation of consumer-based brand equity which is largely under researched. Accordingly, the study proposed the following relationship.
11. Year 2015
Hypothesis 2: Consumers' perception of a brand's event sponsorship has a positive influence on brand equity dimensions.
12. III. methodology a) Research Design
A quantitative research was undertaken and a cross-sectional descriptive survey research design in nature was applied in this study. The current study also employed self-administered and person-administered survey to gather information from the sample respondents to test hypothesis that was developed based on theoretical framework. Researchers proposed the use of survey methods in brand equity studies (Keller, 1993).
13. b) Product Stimuli
Most of consumer-based brand equity studies were carried on for single products or general product (Kim & Hyun, 2011). The chosen beer brands were Bedelle Special beer, Dashen beer, Meta Premium beer, St. George beer and Walia beer brands, all brands are familiar and well known to Ethiopian consumers, which is an important criterion to understand consumer-based brand equity (Krishnan, 1996).
14. c) Scale Development
Bollen's recommendation is essential inorder to develop the measurement process and the present study followed his three essential recomendations (Bollen, 1989). The first rcecomendation is, identify the dimensions and latent variables that reprsent the concept to be measured. The second is, cretae indicators based on the past theoretical positions and, the last is specify the rlationship between the observable indicators or variables and the latent concepts or variables they are explain.
The study examined the perceived rather than actual marketing communication elements, due to the following two main reasons. The first one is, as it was stated in the works of Yoo, Donthu, and Lee (2000), it is not fesible to control actual marketing investements in the study. The second cited reason is, percived marketing efforts plays a more direct role in the consumer psychology than actual marketing efforts . They also calimed percived marketing efforts have also a strong meaning and explain consumer behaviors more effcetively than actual marketing efforts.
15. d) Dimensions of Brand Equity
The initial survey instrument to measure consumer-based brand equity was developed incorporating a total of twenty nine (25) items compiled from previous works and the researcher by considering the selected product category adapts the items based
?? = ?? 2 × ?? × ?? ?? 2Year 2015
16. ( E )
The
17. e) Advertising And Event Sponsorships
Advertising spending was measured as the consumers subjective perceptions of advertising spending on for the focal brand. By adapting Yoo, Donthu, and Lee (2000), the study developed items for advertising spending. This study extend the general advertising spending sacles to measure advertising spending on Television, Radio, Print and Outdoor. Furthermore, event sponsorship was measured as the consumers' subjective perceptions of relative frequency of sponsoring the event presented for the focal brand. A total of nine items were adapted to measure event sponsorships.
18. f) Sampling Design
This study used a sample of beer consumer to measure consumer-based brand equity and the target population of the study was defined as consumers of beer (18 years and above). Multi-stage sampling processes were employed to assure the sampling procedure and to get representative data from the target population. Besides, the research employed retailoutlets consumer intercept survey method to collect consumer information. The researchers also used stratified random sampling techniques to select subcities of Addis Ababa, the capital City of Ethiopia. Furthermore, to select the beer retail outlets in each subcity, the researchers used simple random sampling technique. Still to select respondents, the research used a convenience-systematic sampling technique finally, 600 actual beer consumers were systematically selected by applying Israel (1992) formula. IV.
19. Results
20. a) Normality Of The Data
Calculating the value of skewness and kurtosis is a common rule-of-thumb to examine normality of the data, and it is performed by running descriptive statistics. Tong (2006) stated skewness and kurtosis should be within the absolute value of 2 (+2 to -2 range) to indicate that the data are normally distributed (Table 1). Accordingly, normality analysis for 9 variables was conducted with SPSS 20. The value indicated that all the variables were normally distributed. To measure brand equity dimensions, five indicator variables were available for brand awareness construct (BAW1, BAW2, BAW3, BAW4, and BAW5); nine for brand associations (BAS1, BAS2, BAS3, BAS4, BAS5, BAS6, BAS7, BAS8 and BAS9); for perceived quality, six (BPQ1, BPQ2, BPQ3, BPQ4, BPQ5 and BPQ6) and five indicator variables were the principal descriptors of brand loyalty (BLY1, BLY2, BLY3, BLY4 and BLY5). One loading per construct was set to the value of 1.0, to make ach construct scale invariant, the variables with fixed loadings were PAT2, PAR2, PAP3, PES2, BAW1, BAS2, BPQ1, BLY5 and OBE4. (Fornell & Larcker, 1981). After this all other factor loadings (??) were equal and above 0.50 and statistically significant. Fornell and Larcker (1981) argued that for the convergent validity the factor loadings and average variance extracted in structural equation mdeling should be greater than 0.50. For all the constrcuts, the average variance extracted for each of the factors is calculated mannually by using the formula suggetsed by Hair, Black, Babin and Anderson, (2010). Furthermore, to test hypotheses, the present study used a standerdized loadings greater than 0.5 (the cut-off point), t-values greater than 2.0 (the minimum criteria), and a squared multiple corelation values of 0.4 and above (Taylor & Todd, 1995) (Table 3& 4). The measuremet model in the present study was estimated by using the Maximum Likelihood Estimation Method, the most commonly used approach in structural equation modeling (Chou & Bentler,195), which is a known to perfform a reasonable well under a variety of less-than-optimal conditions as an example small sample size (Hoyle & Panter, 1995).
21. d) The Structural Model
Structural equation modeling was developed to assess the statistical significance of the proposed hypothetical relationships between overall consumerbased brand equity and its dimensions. The model fit indices provide an absolute model fit for the structural model. Goodness-of-Fit (GFI) obtained is 0.99 as against the recommended value of 0.90 and above; the obtained Adjusted Goodness-of-Fit Index (AGFI) is 0.94 as against the recommended value of 0.90 and above; Normal Fit Index (NFI) 1.00 and Comparative Fit Index (CFI) are 1.00 as against the recommended value of 0.90 and above (Table 5). Moreover, the obtained value for Root Mean Square Residuals (RMR) and Root Mean Square Error of Approximation (RMSEA) is 0.01 and 0.05 respectively as against the recommended value of 0.09 and 0.10 and below respectively (Table 6). From these information's, it is concluded that the proposed research model fits the data reasonably.
22. V. analysis and Discussion
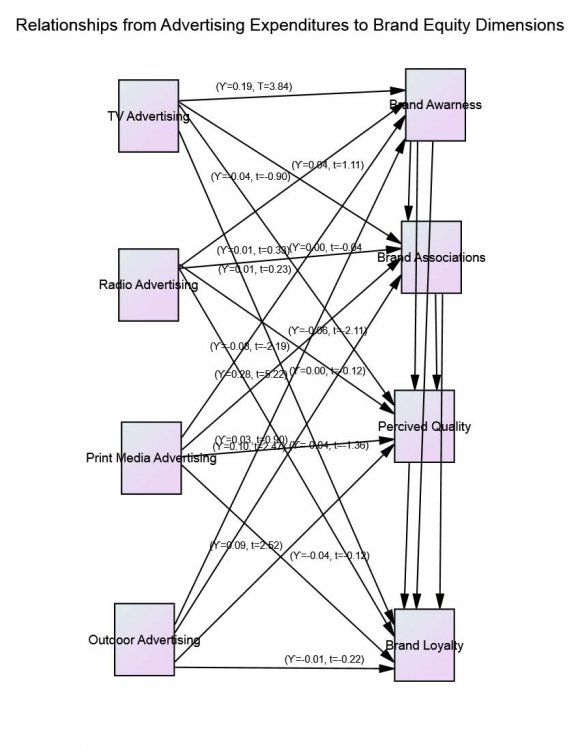
All the hypotheses of the study were tested by structural equation model by using SPSS AMOS 21 version. The total number of hypotheses is twenty; sixteen hypotheses referred to the effects of advertising expenditures on brand equity, and four hypotheses referred to the effects of event sponsorships on the brand equity. Since all hypotheses in this study were However, contrary to the proposed expectation, the result revealed the relationship from television advertising to brand associations (?=0.04, t-value=1.11) was not significant, hence, hypothesis 1-2 was not supported. Moreover, a negative and insignificant path to perceived quality (?=0.00, t-value=-0.04) and brand loyalty (?=0.00, t-value=-0.12) were found; hence H1-3 and H1-4 were not supported. The study indicates in the Ethiopian context, although television is by far the most popular medium, it is losing its effectiveness in creating brand associations, perceived quality and brand loyalty.
23. b) Radio Advertising
Hypotheses H1-5, H1-6, H1-7 and H1-8 were formulated that radio advertising is likely to create brand awareness, brand associations, brand perceived quality and brand loyalty. Contrary to the proposed hypothesis, the data revealed a surprising revers relationships between radio advertising and brand perceived quality (?=-0.06, t-value=-2.11) in the Ethiopia beer market context consistent with a general advertising study finding (Buil, de Chernatony, & Leslie, 2010). Hence, H3-7 was supported in the opposite way. The study finding might indicated that the higher the radio advertising spending intensity, the lower the perceived quality level likely to be. A negative effect of advertising on the creation of brand equity was also shown in the previous studies and the probable mentioned cause was over advertising (Wang, Zhang, & Ouyang, 2009).
The path from radio advertising expenditures to brand associations (?=-0.04, t-value=-0.90) and radio advertising to brand loyalty (?=-0.04, t-value=-1.36) were not positive and insignificant. In addition, the path from radio advertising expenditure to brand associations (?=0.01, t-value=0.33) was positive and insignificant. Hence H3-5, H3-6 and H3-8 were not supported. Furthermore, the finding of the present study showed radio advertising investment does not necessarily enhanced brand awareness, brand associations and brand loyalty. The study findings also supported the arguments of Keller and Lehmann (2006), as they argued the amount of financial investments on marketing activities does not guarantee success in terms of brand equity creations.
24. c) Print Advertising
Hypotheses H1-9, H1-10, H1-11 and H1-12 were formulated that print advertising is likely to create brand awareness, brand associations, brand perceived quality and brand loyalty. Contrary to the proposed hypotheses, the data revealed a surprising revers relationships between print advertising and brand associations (?=-0.08, t-value=-2.19) in the Ethiopia beer market context, consistent with general perceived advertising study (Buil, de Chernatony, & Leslie, 2010). Hence, H3-10 was supported in the opposite way. The finding might indicated the higher the print advertising frequencies, the lower the brand associations are likely to be. Negative effect of advertising spending on the creation of brand equity was registered in previous studies and the probable cause might be over advertising (Wang, Zhang, & Ouyang, 2009).
The path from print advertising expenditure to brand awareness (?=0.01, t-value=0.23) and brand perceived quality (?=0.03, t-value=0.90) were positive and insignificant. In addition the path from print advertising expenditures to brand loyalty (?=-0.04, t-value=-0.12) was not positive and significant. Hence, H1-9, H1-11 and H1-12 were not supported. The study findings revealed that in the Ethiopia beer market context, print advertising expenditures does not necessarily enhanced brand awareness, perceived quality and brand loyally.
25. d) Outdoor Advertising
Hypotheses H1-13, H1-14, H1-15 and H1-16 were formulated and tested that outdoor advertising positively affects brand awareness, brand associations, perceived quality and brand loyalty. The data in this study strongly supported the projected relationships of H1-13, H1-14 and H1-15 that are, the path to brand awareness (? =0.28, t-value=5.22), brand associations (? =0.10, t-values=2.47) and perceived quality (? =0.09, t-value=2.52) to outdoor advertising were positive and significant. The present study findings showed that the higher the outdoor advertising intensity, the higher brand awareness, brand associations and perceived quality levels are likely to be. This indicates the outdoor advertising strategies used by the Ethiopian brewery industry were more effective in improving and creating brand awareness, creating strong, unique and favorable brand association and in formulating positive perceived quality. Furthermore, outdoor advertising frequencies affect brand awareness, brand associations and brand perceived quality and subsequently the creation of consumer-based brand equity.
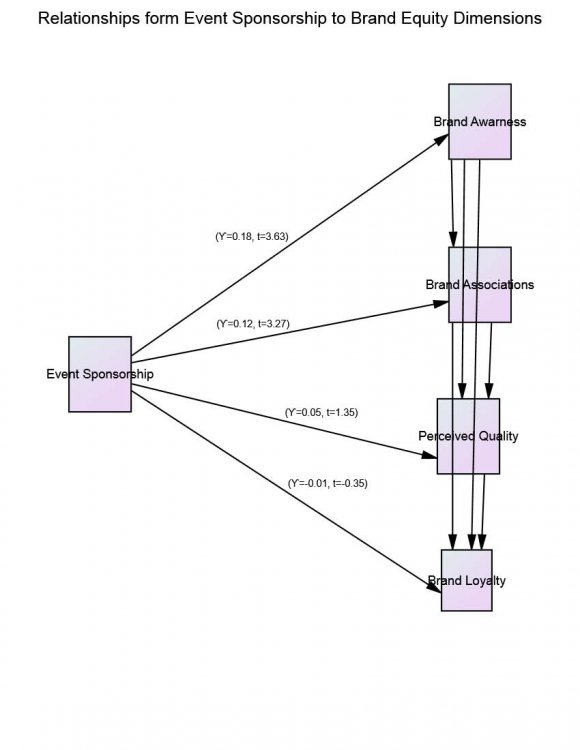
A negative insignificant path was found to brand loyalty (? =-0.01, t-value=-0.22) from outdoor advertising. Hence, H1-16 was not supported. The finding indicated outdoor advertising investments does not necessarily enhanced brand loyalty. Finally, the study findings indicated that compared with television, radio, print and outdoor advertising spending intensity, outdoor advertising spending is more effective in creating brand equity. On the other hand, the path to perceived quality (?=0.05, t-value=1.35) from event sponsorship were weaker and insignificant. A negative path and insignificant relationship were also found to brand loyalty (?=-0.01, t-value=-0.35) from event sponsorship; hence H2-3 and H2-4 were not supported. The findings indicated that event sponsorship in Ethiopia is not effective in formulating a good perceived quality and creating loyal consumers.
26. Global Journal of Management and Business Research
Volume XV Issue X Version I Year 2015
27. ( E )
The Effects of Advertising Spending and Event Sponsorship on Brand Equity in the Ethiopian Brewery Industry VIII.
28. Managerial Implications
Managers should aware of the alternative media and develop effective marketing communication program to createa strong, favorable and unique awareness, brand associations, perceived quality and brand loyalty, because each alternatives affecting consumer-based equity creations differently. In addition, marketing managers should have knowledge on towards the effects of alternative perceived advertising media frequency on consumers' perceptions and behavior. As an example, television advertising spending perceived by consumers improves brand awareness, but not enough to influence positively brand associations, brand perceive quality and brand loyalty. Furthermore, brand managers should have knowledge towards the effects of event sponsorship on consumer perception and behavior. The study indicated that event sponsorship has a positive influence on the first two dimensions of consumer-based brand equity (brand awareness and brand associations) but no effect on brand perceived quality and brand loyalty.
IX.
29. Summery
The study findings revealed that some of the marketing communication activities affecting the creation of consumer-based brand equity positively with different level of intesnity; some other marketing communication elements affecting the cretaion of consumer-based brand equity negatively; and some others marketing communication actions does not have any impct on the creation of consumer-based brand equity.
With regrading to perceived advertising spending, consumers' perceptions towards perceived television advertsing spending has a positive effect on brand awaness; print advertising spending has a positive effect on brand awarness; and outdoor advertsing spending has a positive effect on brand awarness, brand associations and brand percived quality; indicating outdoor advertisinh has more effect on the creation of consumer-based brand equity in the Ethiopian brewery industry. On the contrary, consumers' perceived radio advertsing frequency has a negative effect on percived quality; and prinit advertising spending has a negative effect on brand associations. With regarding to event sponsorships, the study come up with the following inferences; that are, consumers' event sponsorship perception has a positive effect on brand awarness and brand associations.
30. X. Limitations and Direction for Future Reserchs
The current study examined the effects of individual advertising spending and event sponsorship variable and does not examine the interactions the variables. So that, future research needed to examine the interaction effect and examine other marketing communication effects. Besides, since, the current study is limited to beer product; future researches should undertaking in different product categories in order to enhance the generalizability of the findings in Ethiopian context. Furthermore, the future research should focus on actual measures of marketing communication activities and combine actual measures with perceptual measure to have a full picture of brand equity.

| associations. Measure of brand awarness were adapted |
| from Aaker (1991), Yoo, Donthu, and Lee (2000) and |
| Yoo and Donthu (2001) studies. To measure brand |
| associations, nine items for which were developed |
| based on Aaker (1996), Keller (1993), Pappu, Quester, |
| and Cooksey (2005), Lasser, Mittal, and Sharma (1995), |
| Yoo, Donthu, and Lee (2000) and Yoo and Donthu |
| (2001) studies.The study adapts six item to measure |
| percived quality from Aaker (1991), Lasser, Mittal, and |
| Sharma (1995), Yoo, Donthu, and Lee (2000), Yoo and |
| Donthu (2001) and Pappu, Quester, and Cooksey |
| (2005) studies. Based on the works of Yoo, Donthu, |
| and Lee (2000), Yoo and Donthu (2001) and Pappu, |
| Quester, and Cooksey (2005), five items were used to |
| capture the consumer's overall commitement of being |
| loyal to a focal brand. |
| on the context of Ethiopian market. To measure brand |
| awareness, the reserch adapt five items to mesure |
| brand awarness and nine items to meaure brand |
| Constructs | Skewness | Kurtosis |
| Perceived Advertising Spending: Television | -0.347 | 0.098 |
| Perceived Advertising Spending: Radio | -0.264 | 0.46 |
| Perceived Advertising Spending: Print | -0.178 | 0.222 |
| Perceived Advertising Spending: Outdoor | -0.304 | 0.141 |
| Perceived Event Sponsorship | -0.283 | 0.037 |
| Brand Awareness | -0.372 | -0.147 |
| Brand Associations | -0.433 | -0.037 |
| Brand Perceived Quality | -0.310 | -0.279 |
| Brand Loyalty | -0.215 | -0.722 |
| Source: 2015 Survey Data | ||
| b) Reliability | & Bernstein., 1994; Hair, Black, Babin, & Anderson, | |
| Measure of the internal consistency of the | 2010).In general, the Cronbach's alpha values for all the | |
| constructs was calculated through Cronbach's Alpha, | constructs were above the 0.70 threshold (Hair, Black, | |
| with a minimum criterion of approximately 0.70 (Nunnally | Babin, & Anderson, 2010). | |
| Year 2015 | ||
| 20 | ||
| E ) | ||
| ( | ||
| Constructs | Number of Items | Cronbach's Alpha |
| Perceived Advertising Spending: Television | 6 | 0.78 |
| Perceived Advertising Spending: Radio | 6 | 0.77 |
| Perceived Advertising Spending: Print | 6 | 0.77 |
| Perceived Advertising Spending: Outdoor | 5 | 0.80 |
| Perceived Event Sponsorship | 8 | 0.82 |
| Brand Awareness | 5 | 0.80 |
| Brand Associations | 9 | 0.79 |
| Brand Perceived Quality | 6 | 0.87 |
| Brand Loyalty | 5 | 0.86 |
| Source: 2015 Survey Data | ||
| © 2015 Global Journals Inc. (US) 1 |
| Item | Construct Statement | Standar | T- | Squared | ||
| Code | dized | Values | Multiple | |||
| Loading | Correlation | |||||
| Perceived Advertising Expenditure on Print Media (CR=0.98, AVE=0.89) | ||||||
| PCE2 In general, I like the TV advertising campaigns for "X" | 0.63 | - | 0.40 | |||
| PCE3 My opinion about "X" TV advertising is very high | 0.65 | 11.79 | 0.43 | |||
| PCE4 I remember the last TV advertising campaigns for "X" | 0.58 | 10.77 | 0.33 | |||
| PCE5 "X" is intensively advertised on TV. PCE6 The TV advertisement for "X" seem very expensive, compared to competing brands. PCE7 The TV advertisement for "X" is seen frequently. | 0.63 0.44*** 8.59 11.54 0.70 12.27 | 0.40 0.19 0.49 | Year 2015 | |||
| Perceived Advertising Expenditure on Radio Adv.(CR=0.98, AVE=0.91) | ||||||
| PAT2 In general, I like the TV advertising campaigns for "X" | 0.57 | - | 0.32 | |||
| PAT3 My opinion about "X" TV advertising is very high PAT4 I remember the last TV advertising campaigns for "X" PAT5 "X" is intensively advertised on TV. PAT6 The TV advertisement for "X" seem very expensive, compared to competing brands. PAT7 The TV advertisement for "X" is seen frequently. Perceived Advertising Expenditure on Print Media (CR=0.98, AVE=0.90) 0.64 10.84 0.61 10.56 0.68 11.22 0.41*** 7.82 0.73 11.65 PAR2 In general, I like the Print advertising campaigns for "X" 0.59 -PAR3 My opinion about "X" Print advertising is very high 0.64 11.15 PAR4 I remember the last Print advertising campaigns for "X" 0.47*** 8.96 PAR5 "X" is intensively advertised in print publication. 0.73 11.97 | 0.41 0.37 0.46 0.16 0.53 0.35 0.41 0.22 0.53 | Volume XV Issue X Version I | ||||
| to competing brands. PAR6 The print advertisement for "X" seem very expensive, compared | 0.50 | 9.29 | 0.25 | ( E ) | ||
| PAR7 The print advertisement for "X" is seen frequently. Perceived Advertising Expenditure on Outdoor Adv. (CR=0.98, AVE=0.91) 0.65 11.24 PAO2 In general, I like the outdoor advertising campaigns for "X" 0.71 -PAO3 My opinion about "X's" outdoor advertising is very high 0.74 14.50 PAO4 "X" is intensively advertised in outdoor 0.65 13.13 PAO5 The outdoor advertisement for "X" seem very expensive, compared to competing brands. 0.56 11.53 PAO6 The outdoor advertisement for "X" is seen frequently. 0.67 13.44 Perceived Event Sponsorship (CR=0.98, AVE=0.98) PES2 In general, I like the event sponsorship for "X" 0.69 -PES3 My opinion about "X's" event sponsorship is very high 0.60 12.40 PES4 I remember the last event sponsored by "X" 0.40*** 8.44 PES5 "X" sponsors many different events 0.67 13.70 PES6 The event sponsorship for "X" is seen frequently in sports, music or other events 0.65 13.41 PES7 I expect "X" to sponsor major events 0.61 12.57 PES8 The event sponsorship for "X" is intensively used 0.63 13.06 to competing brands. PES9 The event sponsorship for "X" seems more frequent, compared 0.62 12.76 | 0.42 0.51 0.54 0.42 0.31 0.44 0.48 0.36 0.16 0.45 0.42 0.37 0.40 0.38 | Global Journal of Management and Business Research | ||||
| CR=Composite Reliability; AVE =Average Variance Extracted | ||||||
| Confirmatory factor analysis is a theory or | constructs and to evaluate the items of the construct | |||||
| hypothesis driven analysis technique and a special case | more thoroughly based on the correlation matrix of the | |||||
| of structural equation modeling that corresponds to the | items. A completely standardized solution produced by | |||||
| measurement model (McDonald, 1978). It is the best | IBM SPSS AMOS 21 Maximum Likelihood Estimation | |||||
| method to detect the uni-diemsionality of each | Method showed that all twenty nine items were loaded | |||||
| Year 2015 | |||||
| 22 | Brand Awareness (CR=0.98, AVE=0.90) | ||||
| BAW 1 | I am aware of "X". | 0.69 | - | 0.47 | |
| BAW | When I think of beer, "X" is one of the brands that comes to my | ||||
| 2 | mind | 0.65 | 12.95 | 0.42 | |
| BAW | "X" is a brand of beer I am very familiar with | ||||
| 3 | 0.77 | 14.63 | 0.59 | ||
| BAW 4 | I know what "X" looks like. | 0.62 | 12.49 | 0.38 | |
| BAW | I can recognize "X" among other competing brands of beer. | ||||
| 5 | 0.66 | 13.15 | 0.43 | ||
| Brand Associations (CR=0.98, AVE=0.90) | |||||
| ( E ) | BAS1 Some characteristics of "X" come to my mind quickly. | 0.68 | - | 0.46 | |
| BAS2 I can quickly recall the symbol or logo of "X". | 0.56 | 11.85 | 0.31 | ||
| BAS3 I have difficulty in imagining "X" in my mind. | -0.12 | -2.63 | 0.01 | ||
| BAS4 Considering what I would pay for "X", I would get much more than my money's worth | 0.51 | 10.91 | 0.26 | ||
| BAS5 "X" has a strong personality | 0.63 | 13.20 | 0.40 | ||
| BAS6 "X" is interesting | 0.73 | 14.89 | 0.53 | ||
| BAS7 I trust the company which makes "X" | 0.71 | 14.63 | 0.51 | ||
| BAS8 I like the company which makes "X" | 0.65 | 13.51 | 0.42 | ||
| BAS9 The company which makes "X" has credibility | 0.66 | 13.71 | 0.44 | ||
| Perceived Quality (CR=0.99, AVE=0.93) | |||||
| BPQ1 "X" is of high quality. | 0.73 | - | 0.53 | ||
| BPQ2 The likely quality of "X" is extremely high. | 0.72 | 16.02 | 0.51 | ||
| BPQ3 "X" is a quality leader within its category | 0.77 | 17.23 | 0.60 | ||
| BPQ4 The likelihood that "X" will be satisfactory is very high | 0.73 | 16.37 | 0.54 | ||
| BPQ5 Compared to its competitors, I appreciate "X" | 0.72 | 16.10 | 0.52 | ||
| BPQ6 Compared to its competitors, I respect "X" | 0.72 | 16.00 | 0.51 | ||
| Brand Loyalty (CR=0.98, AVE=0.92) | |||||
| BLY1 I consider myself loyal to "X". | 0.77 | - | 0.57 | ||
| BLY2 "X" would be my first choice. | 0.82 | 18.83 | 0.68 | ||
| BLY3 I will not buy other brands if "X" is available at the store. | 0.73 | 16.74 | 0.53 | ||
| BLY4 I will buy "X" again | 0.73 | 16.86 | 0.54 | ||
| BLY5 I will suggest "X" to other consumers | 0.68 | 15.72 | 0.47 | ||
| © 2015 Global Journals Inc. (US) 1 | |||||
| Source: 2015 Survey Data |
| Source: 2015 Survey Data |
| (Cobb-Walgren, Ruble, & Donthu, 1995); increase the | |||||
| scope and frequency of brand appearance, | |||||
| subsequently increase the level of brand awareness | |||||
| (Chu & Keh, 2006; Keller K. L., 2007); and increase the | |||||
| brand's likelihood of being included in consumers mind | |||||
| set (Aaker D. A., 1991; Yoo, Donthu, & Lee, 2000; | |||||
| Huang & Sarigöllü, 2012). | |||||
| Year 2015 | Fit Measures | Recommended Values | Values from the Model | Conclusion | Year 2015 |
| Chi-square (X²) | P?0.05 | 0.00 | Not Fit | ||
| Chi-square (X²)/df | ?3.00 | 2.95 | Fit | ||
| Goodness of Fit (GFI) | ?0.90 | 0.84 | Moderately Fit | ||
| Adjusted Goodness of Fit (AGFI) Norm Fit Index (NFI) Comparative Fit Index (CFI) Root Mean Square Residuals (RMR) (RMSEA) Root Mean Square Error of Approximation | ?0.80 ?0.90 ?0.90 ?0.09 ?0.10 | 0.80 0.85 0.90 0.06 0.06 | Fit Moderately Fit Fit Fit Fit | Volume XV Issue X Version I | |
| E ) | |||||
| Fit Measures Goodness of Fit (GFI) Chi-square (X²) Chi-square (X²)/df Adjusted Goodness of Fit (AGFI) Norm Fit Index (NFI) Comparative Fit Index (CFI) Root Mean Square Residuals (RMR) Root Mean Square Error of Approximation (RMSEA) | Recommended Values P?0.05 ?3.00 ?0.90 ?0.80 ?0.90 ?0.90 ?0.09 ?0.10 | Values from the Model 0.01 2.56 0.99 0.94 1.00 1.00 0.01 0.05 | Conclusion Not Fit Fit Fit Fit Fit Fit Fit Fit | ( Global Journal of Management and Business Research | |