1. Introduction
ervice quality evaluation in companies which offer electronic and online services differs with the quality of traditional services. In offering these kinds of services, factors such as time, access and system performance play a highly important role. Subsequently, rapid quality is one of the key factors in offering these kinds of services. Since each customer has his/her specific viewpoints about and expectations from service, customers' mutual needs and expectations should be taken into account to detect the key important specifications of service quality evaluation from the customers' point of view. By determining these specifications and their importance to the customer, efforts can be made in the time of the customer's dissatisfaction to resolve the problem and raise service quality. Furthermore, these specifications help the company use its resources in the way which has the most qualitative improvement, finally resulting in keeping the customers and boosting the company's profit.
By improving point of sale (POS) network we will witness, on the one hand, the gradual removal of bill and the negative consequences of its production and distribution on the country's economic system, resulting in national productivity increase through increasing daily transactions' productivity, and on the other hand by raising public trust and belief in the productivity of POS cards and machines, conditions will be better for the decrease of money supply among people, and many minor adrift and static capitals will return to the country's economic system and in this situation the economical boom of the country will become easier. This amount of progress in electronic banking, on the one hand, and the huge amount of the literature on the current topic in identifying the key aspects of customers' service quality, customers' satisfaction, and customers' loyalty in the banking environment, on the other hand, and also very few research conducted in the banking environment where non-human interactions are the main channel of connection and service evolution, determine the significance of this research. Therefore, attempts have been made in the present research to identify and to study the effective factors in electronic service quality and finally testing their relationship with the costumers' satisfaction of the quality of offered services.
2. II.
3. Customer Satisfaction (CS)
Today's, the necessity of continuing activities and maintaining the competitive advantage is attention to customers (Mozaheb, Alamolhodaei and Fotouhi Ardakani, 2015). Customer satisfaction is one of the most important variables for long-term business success. Particularly, a review from these studies, interrelationship among service evaluation, loyalty and other related topics with culture . It is stated by Bitner and Zeithaml (2003) that "satisfaction is estimation of customers of a service or product either those fulfill their hopes and requirements. For instance, CS has been found to reduce the costs for attracting new customers and dealing with poor quality, defects and complaints (Michel, Bowen and Johnston, 2009). Reflecting these benefits, CS has been found to improve the long-term financial performance of firms (Williams and Naumann 2011), have positive impact on loyalty (Chenet, Dagger and O'Sullivan, 2011), be applicable predictor for purchase intention (Kuo, Wu and Deng, 2009), increase firm profitability (Williams and Kaumann, 2011) enhance firm's market value (Kanning and Bergmann, 2009) and relationship with culture (Rajendran and Lokachari, 2010; Chan and Wan, 2008). From the translation of many researchers it was observed that satisfaction is a sense of feeling which comes from a procedure of interpreting and judging what is received as a result of expectation as an inclusion of wishes and requirements coupled with the purchase and purchase choice (Armstrong & Kotler, 1996). It is discussed by Giese and Cote (2000) as an evaluative concept that satisfaction is the Current studies and practices in marketing have rekindled interest in and understanding of the role of CS in several ways, and many academicians have studied the relationship CS and SQ (Ladhari, 2009) in the context of retailing, as a result of the studies CS may be explained within these critical approaches ; First, CS is not only the pre-dominant objective for the marketing function in the retail outlets, it is also the summary measure for evaluating the performance of different constructs of the overall satisfaction, such as, pricing or product assortment (Qin & Prybutok, 2009).
Second, CS is a critical predictor for customer loyalty, profitability of the retailer's marketing activities, purchasing and re-purchasing behavior and the retailer's performance (Kuo, Wu & Deng, 2009).
Third, CS provides a common constructs for comparing the impacts of constructs on marketing performance across diverse industries and geographical locations (Kuo, Wu & Deng, 2009).
III.
4. E-Service Quality
E-Service quality refers to the consumers overall evaluation and judgment of the excellent and quality of electronic service offering in the virtual marketplace (Santos, 2003). A number of scales have been developed to measure the e-SQ in e-commerce environment such as, E-SERVQUAL (Parasuraman, Zeithaml, & Malhotra, 2005).
The most well-known scale is SERVQUAL that is developed by Parasuraman, Zeithaml & Berry (1985), and the scale is based on the estimated disconfirmation method whereby the gaps between a customer's expectation and perception are tested. Although there has been a consensus that SERVQUAL has a validated scale for measuring SQ in various service settings, incongruities have been remained over some aspects of the scale. However, this approach criticized by many researchers Mehta, Lalwani & Han (2000); Dabholkar, Dayle & Joseph (1996); Bouman & Van Der (1992). The rationale of criticism, as emphasised in the studies of Mehta, Lalwani & Han (2000) and Bouman and Van Der (1992), customer's expectation of services can be marked better than performance by customers. For instance, Babakus & Boller (1992) used the SERVQUAL scale for measuring SQ in their study, and they found, as measured in the SERVQUAL scale, score of relies in the perceptions more remarkably than expectations. Customers' demand do not basic products or affordable prices, however also convenience shopping experience (Martinelli and Balboni, 2012). Earlier studies addressed to measuring SQ in the retailing settings have often started from SERVQUAL (Parasuraman, Zeithaml and Berry, 1985).The scale operationalizes SQ by calculating the difference between customer's expectation and recent performance, evaluating both in relation to the 22 items that are classified under five broad categories. The SERVQUAL scale has been examined and/or adapted in a great number of studies conducted in various service settings such as; health care (
5. Global Journal of Management and Business Research
6. IV. Hypothesis and Research Framework
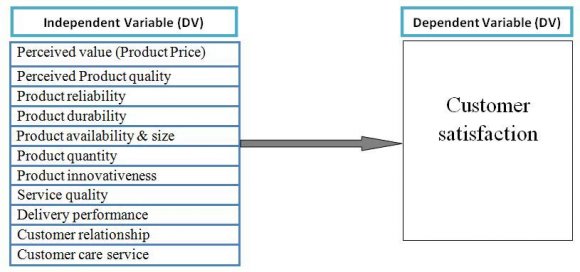
In this study, we used to Kim and et al (2008) and SERVQUAL for measurement of E-Service Quality of Point of Sale (POS). In finally, authors used 6 variables for survey of customer satisfaction (see fig 1). This study propose the following hypothesis:
1) There is relationship between customer satisfaction and reliability of POS.
2) There is relationship between customer satisfaction and responsiveness of POS.
3) There is relationship between customer satisfaction and ease of use of POS.
4) There is relationship between customer satisfaction and cost of POS.
5) There is relationship between customer satisfaction and useful of POS.
6) There is relationship between customer satisfaction and security of POS.
7) There are different relationship between customer satisfaction and E-service quality.
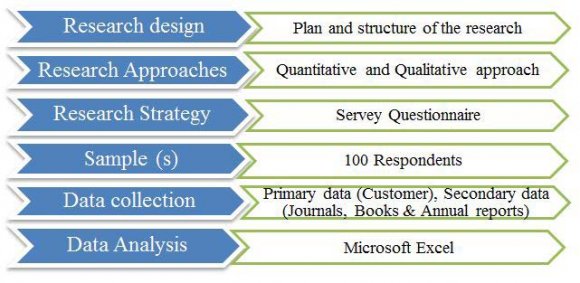
7. Research Methodology
This research, initially used library resources to review the subject literature, then a questionnaire was designed consisting of two parts: demographic (age, education and agenda) and the main body as a measuring tool. The main body of the questionnaire that measures the main variables of the study is a combination of questionnaires about E-service quality factors. which makes 34 questions(including: reliability 7 questions, responsiveness 4 questions, ease of use 5 questions, cost 3 questions, useful 6 questions, security 5 questions and customer satisfaction 4 questions )based on a five-point Likert scale(from 1: very disagree to 5: very agree). The questionnaires were used after localizing and necessary modifications to fit the target population. The subjects of the study are in the stores.
8. a) Sampling
The population of this study, shoppers and stores are Ardakan city, Iran and sample its stores and shops in the city which has customers randomly selected. In order to determine the reliability of the instrument, a pre-test was conducted with a sample size of 25 customers in this city. The results of the pre-test indicated the reliability of the measurement tool with Cronbach's alpha 82.1%. The total of 200 questionnaires were distributed of which only 180 questionnaires were usable (Rate of Return: 90.0%). Demographic data obtained from the samples are shown in Table 1.
9. b) Reliability and Validity Analysis
In this study, standard questionnaires are used to assess the validity of questionnaire we use. And, after its localization, its initial questionnaire was drawn and by the time of codification, the researcher distributed questionnaires among experts, scholars, and also some of customers, then after collecting opinions of the group, corrective enterprises in the initial questionnaires get under way. Then, in the next stage the researcher distributed 30 questionnaires among customers. Finally, considering customers' opinions and experts' and advisors' final considerations, final questionnaire was codified.
In this study, reliability or trust ability of the questionnaire is assessed by measurement method of Cronbach's ? by using SPSS software. In order to assess the reliability level, an examination with a sample of 200 customers was taken in Ardakan. Test results indicate that the reliability measurement of Cronbach's ? coefficient was 91.4%, which was statistically of a desired rate. To summarize, the measurement indicators of the questionnaire in this study have good reliability and VI.
10. Data Analysis
In this study, SPSS software has been used for data analysis. In order to test the relationship between variables, correlation test was used. The results of correlation test is shown in Table (2).
11. Table 1 : Correlation between Variables
It can be seen, all variables related to E-Service Quality are correlated with Customer Satisfaction. Variable of reliability is the Lowes mean. It showed reliability of POS are low to users and customers. In addition, cost and ease of use variables reveal the highest correlation with customer satisfaction. Also all of the variables Correlation is significant at the 0.01 level with customer satisfaction.
Path analysis, which is a generalized form of multiple regression method in the formulation of causal models, in addition to direct effects, indirect effects of each of independent variables on the dependent variables are identified. The default linear regression used in the path analysis, shows that the Distribution of dependent variables is normal or near normal. . In order to verify the normality of data, Kolmogorov -Smirnov single sample 2 was used. This test compares the observed cumulative distribution function and the normal theoretical cumulative distribution function. Test results of Kolmogorov -Smirnov showed that for most variables trait distribution in the sample with its distribution in society, is not normal and there is a significant difference between observed and expected frequencies. So being aware of the abnormal data distribution, we used their natural logarithm for performing regression. Finally, the preliminaries were provided for path analysis. In conducting the path analysis, customer satisfaction was considered as the final dependent variable, Useful, ease of use, responsiveness, reliability, security and cost as independent variables. The results of the path analysis process is shown in table (3). The stepwise method was used in this path analysis, accordingly, all factors are put into the regression and then each of the variables that have significant impact are shown. One of the most important assumptions in testing causal relationships, is the lack of co linearity relationship between variables. A high co linearity regression equation signifies a low validity, despite the high coefficient of determination. For the co linearity test, Variance Inflation Factor was used, which is reverse of tolerance statistic. Tolerance is a proportion of variance which is not explained by other independent variables. The lower the tolerance, the higher VIF index, and thereby the rate of co-linearity increases. This leads to the increase of variance of regression coefficients and causes adverse regression model for prediction. In the present study, the maximum VIF in the regression models used in all procedures of the path analysis is 1.130, which is an acceptable number. Therefore, through the VIF index we can realize the low co linearity between independent variables and also concluded that the validity of the model is relatively high. In order to answer the question which of the variables have a stronger impact on customer satisfaction, the impact of direct, indirect and total effects were calculated. The results are shown in Table (4). For answer to this question, which variables have a more impact on customer satisfaction we calculate direct and indirect effect (see fig 2). Finding indicate reliability haven't direct impact on customer satisfaction but reliability have an indirect effect. Also security have a most effect on customer satisfaction. Therefore, responsiveness have low negative impact on the customer satisfaction. It can be seen, all variables related to E-Service Quality are significant correlated with Customer Satisfaction. In result, accepted all hypothesis.
12. Variables
13. VII. Conclusions and Suggestions
The inferential analysis results of this research show that security and being useful have the highest effect on customers' satisfaction, a result which is in line with that of Ganguli and Roy (2011). Suggesting a positive significant effect of security on customers' satisfaction and loyalty. It is also in line with Macgregor and Vrazalic (2005) that the high cost of Internet access and also communicational infrastructures being insufficient are obstacles to accepting to use the POS machines, and responsiveness has the lowest effect on customers' satisfaction. The authorities can resolve the problem in the shortest possible time, if one comes up. As the results of this research show, to increase the tendency to use and subsequently to increase the true use of POS system in the retailers and stores, the users of POS system should have a thorough understanding of the usefulness and advantages of this system, for which the authorities can play a significant role by applying suitable advertising and strategies. Thus, if the banks intend to expand electronic banking and electronic payment in general, they have to provide the hardware, software, cultural, legal, security infrastructures, and relationship management with the customer, in addition to improving the effective relations and interactions among the organization members, customers, networks and organizational groups.
The present research is an initial effort in identifying the effective factors on customer's satisfaction of the points of sale (POS) in the retailers and stores. Attempts have been made to evaluate all the effective factors on the satisfaction of POS system by using a questionnaire and SPSS software, and to prioritize the importance of each of these factors on customer's satisfaction. Thus, more expanded research is needed to prioritize all the effective factors on POS system acceptance and its application with the aim of increasing customer's satisfaction and the true use of POS. Considering these issues, some suggestions are presented to improve POS quality in shops:
Paying attention to the understanding of POS system's usefulness : considering the fact that the owners of some shops lack high educational levels, the companies which are responsible for installing and operating this system should provide these people with complete and useful information (especially about how to use the POS). As the result of the research indicate, to increase the tendency to use, subsequently improving the true use of POS system in the retails. The users of the POS system should have a complete understanding of the usefulness and advantages of this system.
Paying attention to the understanding of usage ease: Based on the research conducted on the effective factors on the understanding of POS system usage ease, the only effective factor on the understanding of POS system usage ease in the retailers of Ardakan is service quality. By improving service quality, a complete and accurate understanding of POS system usage ease can be presented to the users of this system. To utilize POS system maximally, this factor should be highly invested on.
Improving electronic service quality: In the time of problem occurrence, POS system service supporting company must resolve the problem as quickly as possible, and provide the person with suitable guidelines to use the system correctly. By offering basic and practical guidelines for using POS, service supporting companies can increase the quality of POS system services, and as a result, cause the usage level of this system to improve in the shops. Some further action can also be taken, such as: human resource expansion, planning with the aim of constant improvement through identifying and measuring the effective factors on the quality of the provided electronic services, planning and coordination with the aim of making Internet and electronic units complexes responsive.
Improving offered services responsiveness: To the end, advertising about the services being provided improves the provided services responsiveness. Offering fast services, increasing the speed of service offering and also on time and suitable responsiveness to customer by using electronic-mail, holidays publicizing, etc. through SMS to customers are other strategies which will improve the offered services.
14. Global Journal of Management and Business Research
Volume XV Issue IX Version I Year 2015 ( E )

| Age | Agenda | Education | |||
| Year | % | Agenda | % | Education | % |
| Under 20 | 10.0 | Male | 84.5 | Under diploma | 6.6 |
| 20 -29 30 -39 | 67.7 15.6 | Female | 15.5 | Diploma | 42.9 |
| 40 -50 | 6.1 | N = 180 | Under graduate | 47.2 | |
| Upper 50 | 6.7 | M. A and upper | 3.3 | ||
| Stages | Variable Depend | Sig | R | F | Variable In Depend | Sig | T | Beta | Tolerance | |
| Reliability | .743 | -.328 | -.026 | .506 | ||||||
| 1 | Customer | Satisfaction | 0.0 00 | .683 | 25.0210 | Responsiveness Ease of Use Cost Useful Security | .007 .009 .023 0.000 0.000 | -2.0379 2.0639 2.0297 4.0539 4.1020 | -.201 .303 | .571 .532 .642 .552 .565 |
| Reliability | .474 | .717 | .057 | .508 | ||||||
| 2 | Useful | 0.0 00 | .669 | 28.0187 | Responsiveness Ease of Use Cost | .602 0.000 0.000 | .523 3.0823 3.929 | .039 .284 .265 | .571 .576 .699 | |
| Security | .004 | 2.0956 | .216 | .593 | ||||||
| Reliability | 0.000 | 4.0450 | .345 | .565 | ||||||
| 3 | Security | 0.0 00 | .638 | 30.0006 | Responsiveness Ease of Use | .0008 .074 | 2.0685 1.0795 | .203 .136 | .595 .587 | |
| Cost | .135 | 1.0501 | .104 | .708 | ||||||
| 4 | Ease of Use | 0.0 00 | .643 | 41.0312 | Reliability Responsiveness Cost | .006 0.000 .003 | 2.0765 5.0602 3.0005 | .208 .386 .201 | .590 .701 .745 | |
| 5 | Responsiv eness | 0.0 00 | .547 | 37.0730 | Reliability Cost | 0.000 .281 | 6.0920 1.0082 | .503 .079 | .750 .750 | |
| Effects |