1. Introduction
overty is a multidimensional problem that goes beyond economic to include, among other things, social, political, and cultural issues. The World Bank's 2000 World Development Report defines poverty as an unacceptable deprivation in human well-being that can comprise both physiological and social deprivation. Physiological deprivation involves the non-fulfilment of basic material or biological needs, including inadequate nutrition, health, education, and shelter. Reducing poverty has been receiving much attention in the global policy discourse (Fosu, 2010). A statement made by the United Nations (2000) shows that poverty reduction is considered one of the most important developmental goals in developing and developed countries alike. However, it has been the Goal 1 of the Millennium Development Goals (MDG1) i.e. halving absolute poverty by 2015 using $1 per capita per day as the international poverty line.
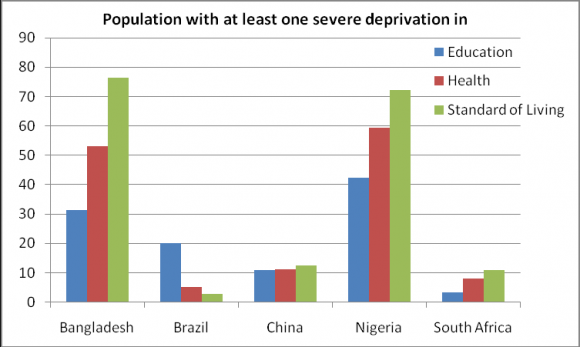
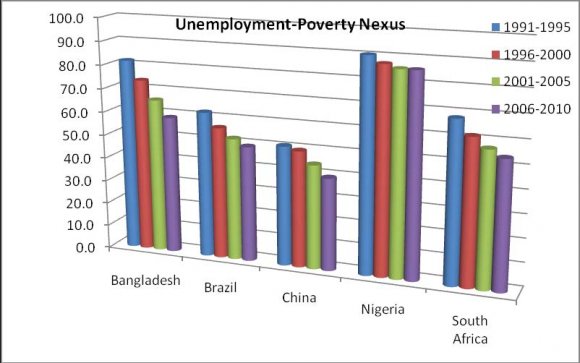
Despite the earnings of Nigeria from oil revenue, a large proportion of the population are still dwelling in abject poverty. Moreover, the resource ought to have transformed into a considerable socioeconomic development of the country, but instead, Nigeria's basic social indicators now place her as one of the 25 poorest countries in the world (Akanbi & Toit, 2010). Fortunately, in the early 1970s, she was among the 50 richest countries in the world. In addition, the Nigerian economy has recorded rising growth in its Gross Domestic Product (GDP), most especially over the past decade. Unfortunately, this has not translated into accelerated employment and a reduction in poverty among its citizens, which has also been the case for many African countries. Trend from her past revenue has revealed that the crude oil endowment has been the major factor fuelling the country's economic growth. In the words of Akanbi & Toit (2011), it is, however, expected that the oil revenue should spill over to the rest of the economy leading to a higher shared income for the owners and non -owners of the factors of production. In fact, the World Bank (2011) includes Nigeria in the list of top 15 places with the highest incidence of poverty. The institution went further to state that out of 162 million of her citizens, 90 million live below the poverty level of $2 a day, despite billions of dollars in oil revenues (see fig. 2.1-2.4 in appendix page). Rupasingha & Goetz (2007) argue that few problems have proven more intractable for social scientists and policymakers than that of poverty.
Based on the 2010/11 data of the World Development Index (WDI, 2014), 46.0% of the total population of the country lives below the national poverty line. The data further show that poverty is more prevalent in rural (52.8%) than urban areas (34.1%) (WDI, 2014). Report from the General Household Survey (GHS) panel revealed that between 2012 and 2013, poverty rate per capita is 33.1% with 44.9% in the rural areas and 12.6% in the urban areas (Emejo, 2014;and World Bank, 2014). On the basis of the foregoing, this study examines the impact of revenue from oil proceeds and government expenditure on poverty rate in Nigeria within the period of 1970 and 2013. The remaining part of this paper is structured into five sections; section two presents stylized fact, section three shows literature review, and section four provides the methodology for the study. Section five reveals data presentation and analysis and discussion of findings. The last section gave the concluding part of the study as well as policy options.
2. Year 2015
Oil Revenue, Government Expenditure and Poverty Rate in Nigeria II. Stylized Facts OF Macroeconomic Performance and Poverty Rate in Nigeria
The Nigerian economy has undergone some structural changes over the past four decades. Prior to the country's political independence in 1960, the economy was largely at a rudimentary stage of development. Between 1960 and 1975, agriculture was the core of economic activities in Nigeria with manufacturing and mining playing the residual role. Thus, agricultural commodities dominated the country's export trade while the imports were dominated by manufactured goods. In spite of the dominance of agriculture, the growth rate of real GDP was very impressive (see appendix page, table 2.12 ). The oil boom of 1973/74 changed the economic environment dramatically. The windfall from oil boom in 1973/74 and 1979/80 had a pervasive effect on the Nigerian economy. The unexpected oil revenue flows provided the basis for large increases in public spending designed to expand socio-economic infrastructure, nonoil productive capacity (e.g., manufacturing) and human capital, among others.
Consequently, the growth rate of money supply rose from 21.8 per cent in 1973 to 52.5 and 67.9 per cent in 1974 and 1975.respectively. In addition, the oil shock also led to the general wage increase of the period. The rising wages, coupled with the appreciating domestic currency that accompanied the boom, squeezed the profitability of non-oil exports while cheap import competed with domestic food production. The oil boom did not only create a Dutch Diseases effect to the agricultural sector but also made Nigeria one of the largest importers of food items with its usual negative effects on the balance of payments (BOP). This led to serious overvaluation of the Naira. Consequent upon this, the BOP position, which had been positive consecutively during 1970 -1973 and 978 -1980 turned negative between 1981 and 1983. In short, revenue from oil became the mainstay of the economy with the three tiers of government depending heavily on it for growth and development.
Expectedly, when international oil prices fell sharply in the early and mid-1980s, Nigeria's economy was almost at the verge of collapse. For instance, the growth rate of real income was negative between 1981 and 1984. The country also built up large fiscal and external deficits and other macroeconomic imbalances ensued. The increase in government spending, which accompanied the oil boom, increased public sector deficit, particularly from I975. For instance, the overall fiscal deficit rose from N365. 8 To address these problems, government introduced several policy measures e.g. Stabilization Act of 1982, budget-tightening measure of 1984 and finally the Structural Adjustment Programme (SAP) introduced in late 1986. These measures, particularly SAP were aimed at building a self-reliant economy as well as diversifying the structure of the Nigerian economy through the revitalization of the manufacturing sector. Capacity utilization, a barometer of operational and productive efficiency within the manufacturing sector, which was as high as 82.4 and 75.0 per cent in 1970 and 1980, respectively declined drastically thereafter. This was as a result of the economic downturn of the early 1980s. Since the adoption of SAP in 1986, capacity utilization has been lower than what obtained in 1986. It fell from an average of 37.8 per cent in 1986 to 30 per cent in 1989. It rose to 36.9 per cent in 1990, declining systematically thereafter to 27.9 per cent in 1995, though with marginal improvement between 1996 and 1998. Most warehouses were filled with inventory of unsold finished products which resulted in retrenchment in and closure of many enterprises. Unfavourable macroeconomic and policy environments have been adduced for this dismal performance in the industrial sector.
Critical among these is the disturbing rate of inflation. The price movement which experienced all average of 3.85 per cent between 1960 and 1969 became more volatile in the 1980s, particularly after the introduction of SAP in 1986. It rose from 11.8 per cent in 1975 -85 to 20.45 and 48.2 per cent during 1986 -90 and 1991 -96, respectively (see Table 2.10.) For instance, inflation rate was as high as 38.3, 57.2 and 72.8 per cent in 1988, 1993 and 1995 respectively. As shown in the table, periods of high inflation often coincided with periods of high growth rate of money supply. During this period, consumers complained bitterly about their declining purchasing power which seriously hindered effective demand in the system. This partly accounts for the piling up of inventories in many companies' warehouses. Another negative impact of the skyrocketing inflation rate is the instability that is often transferred to other macroeconomic variables, thus creating an unconducive atmosphere for investment in
3. Global Journal of Management and Business Research
Volume XV Issue X Version I Year 2015
4. ( B )
Oil Revenue, Government Expenditure and Poverty Rate in Nigeria the real sector of the economy. Thus, speculative and service businesses boom at the expense of productive activities. Such is the case of the past two and a half decades in Nigeria.
5. III.
6. Literature Review a) Theoretical Review
Prior to the endogenous growth model, the modifications of the neoclassical growth model can be made along the lines of thought of Ramsey (1928), Cass (1965) and Koopmans (1965) in Akanbi & Toit (2011) known as "RCK model", which are all centred on social planning problems (not market determined outcomes) that use dynamic optimization analyses of households' savings behaviour (which is taken as a constant fraction of income by Solow). The ideology behind their argument is that agents in the community are identical and that they live forever, which implies that they will maximise their utility over their lifetime.
The endogenous growth theory (i.e. the new growth theory) started gaining popularity in the growth literature of the early 1980s in response to a series of criticism on the assumptions made in neoclassical theory. The new growth theory also gained tremendous popularity because of its strength which can be attributed to its ability to solve most of the limitations of neoclassical growth models as well as to include some socio-economic factors that will propel growth over the long run. These tend to discard the assumption of constant returns to scale, replacing it with increasing returns to scale and thus determining growth mainly by endogenous variables. Technology and human capital are regarded as endogenous, unlike the neoclassical model that assumed these to be exogenous. However, the main emphasis of the long-term growth model is that it does not depend on exogenous factors and, most importantly, that it allows for policies that tend to affect savings and investment (King and Rebelo, 1990).
The assumption of increasing returns posed a major challenge to the new growth models since it does not apply to a perfectly competitive market because production factors cannot be paid from the amount produced. However, by only using increasing returns that are external to the firm, this problem can be circumvented, as was observed by Romer (1986), Lucas (1988), and Barro (1990). Increasing returns have been fully specified in Romer (1986) as a major requirement in achieving endogenous growth, while emphasis on human capital accumulation as endogenous in growth models was explicit in Lucas (1988).
Though most common models of poverty traps are rooted in the neoclassical growth theory (Azariadis & Stachurski, 2005), which is the dominant foundational framework for modelling economic growth (Stone, 2011;Ngonghala, Plucinski, Murray, et al. 2014). Nonetheless, the endogenous growth model has edge over the neoclassical over its assumption of increasing returns. Therefore, the analytical framework and model formulation for this study rely on the endogenous growth model.
7. b) Empirical Review
Literature in the area has stimulated various reaction in the empirical evidence available from cross country comparisons, bearing on the relationship among oil revenue, government expenditure and poverty rate. Mitchell (2005) evaluated the impact of government spending on economic performance in developed countries. Regardless of the methodology or model employed, he concluded that a large and growing government is not conducive to better economic performance. He further argue that reducing the size of government would lead to higher incomes and improve American's competitiveness.
More so, Chirwa (2005) examined the impact of alternative macroeconomic policies on changes in poverty level in Malawi using panel data within 1998 to 2002. The study revealed that macroeconomic policies that facilitate the redistribution of land, creation of salaried employment opportunities and accumulation of assets have the greatest potentials in reducing poverty in rural Malawi. Owoeye and Adenuga (2002) carried out a study on human capital and economic growth. They used co-integration and error correction mechanism to determine the relationship and direction of causality between growth rate and social spending. The time properties of the variables were investigated by conducting a with test using sample period starting from 1970-2000. Their results showed that all the variable were first difference stationary i.e. I(1). Their results also show that GDP co-integrated with all the explanatory variables.
Also, Ali and Thorbecke (2000), provided a detailed analysis of the state and evolution of poverty in African countries (Cote d'Ivoire, Ghana, Nigeria and Uganda), as well as the characteristics of the poor in both rural and urban areas. The study analysed the effects of growth and income distribution on spread, depth and severity of poverty for rural and urban areas. It conducts the sensitivity of poverty to changes in economic growth and income distribution, and found that growth has a bigger effect on poverty in rural than in urban areas. The study also analysed time changes in poverty for several African countries (Cote d'Ivoire, Ghana, Nigeria and Uganda), using a well known decomposition method. The study found a substantial effect of distributional policies on poverty. Specifically, the findings from the study revealed that irrespective of growth performance of countries, poverty fell in the two countries where inequality declined (that is, Ghana and Cote-d'Ivoire) and increased in countries where inequality worsened (Nigeria and Uganda). In a similar study, Ogwumike (2010) discussed the various approaches to the measurement of poverty and inequality, applying such approaches to Africa. The study reviewed the methods for assessing how inequality, poverty and economic well-being in a given country or region have changed over time. Of particular interest to this study are the relationships among economic inequality, economic growth and poverty. The study fund that the Kuznets long run inverted-U relationship between inequality and economic growth is not discernible from African data. The findings from the study revealed that it is not the rate of economic growth or the stage of economic growth that determines whether income inequality increases or decreases, but rather the kind of economic growth witnessed. With regard to the evolution of poverty, Fields (2000) reported that there is currently little or no consensus in the literature on the relative effects of growth and distribution. Thus, inconclusive reports in Africa necessitated the need for understanding poverty from macroeconomic perspective. Furthermore, Datt and Ravallion (1992), corroborated this argument by stating that when the poverty line is held constant overtime, poverty reduction effects of growth are overstated and the contribution of improvements in income distribution are underestimated and vice versa. Thus, the proper understanding of the concept of poverty may be critical to resolving this important debate of the relative importance of economic growth and income distribution for poverty reduction.
8. IV. Model Specification and Estimation Techniques
The study employed and modified the model of Rupasingha & Goetz (2007) to estimate the relationship among revenue from oil proceeds, government expenditure and poverty rate in Nigeria. The model expresses poverty rate (POV) has a function of the government capital expenditure (GCE), gross capital formation (GCF), market size of the host country proxy by gross domestic product (GDP), government recurrent expenditure (GRE), and revenue from oil proceeds (OLR). It is thus presented below as thus:
?????? = ?? 0 + ?? 1 ?????? + ?? 2 ?????? + ?? 3 ?????? + ?? 4 ?????? + ?? 5 ?????? + ?? (3.1)The logarithm value of government capital expenditure (GCE), gross capital formation (GCF), market size of the host country proxy by gross domestic product (GDP), government recurrent expenditure (GRE), and revenue from oil proceeds (OLR) are expressed in smaller case. This is expressed as thus:
?????? = ?? 0 + ?? 1 ð??"ð??"ð??"ð??"ð??"ð??" + ?? 2 ð??"ð??"ð??"ð??"ð??"ð??" + ?? 3 ð??"ð??"ð??"ð??"ð??"ð??" + ?? 4 ð??"ð??"ð??"ð??"ð??"ð??" + ?? 5 ????ð??"ð??" + ?? (3.2)Where ?? 0 is constant, ?? 1?5 are coefficients or elasticities and ?? is the disturbance term.
A'priori expectation anticipates poverty rate to be negatively related to the host country's market size i.e. income, government capital expenditure, gross capital formation, government recurrent expenditure and revenue from oil proceeds. For the purpose of this study, only secondary method of data collection is employed to establish the relationship. Annual (secondary) data of the variables are used, and they were collected from the Central Bank of Nigeria statistical bulletin, 2014 and World Development Index (WDI), 2014. Annual (secondary) data of the variable are used for the period of 1970 to 2013.
The model is estimated using the Ordinary Least Squares (OLS) for long-run estimates. Before estimation, we performed a stationarity (unit root) test using Augmented Dickey Fuller (ADF) that excludes the intercept and trend and Engel Granger cointegration test for long-run relationship. Furthermore, we also conducted the Granger causality test to show the causal relationship among variables of interest.
9. V. Empirical Analysis and Discussions a) Unit Root Test Analysis
The stationary test results of the incorporated times series variables in the regression model expressed in previous section is presented in Table 4.1 using the Augmented Dickey-Fuller (ADF) unit-root test. The test result indicated that the time series variable, government capital expenditure (GCE), gross capital formation (GCF), gross domestic product (GDP), government recurrent expenditure (GRE), and poverty rate (POV) were not found to reject the null hypothesis "no stationary" at level. This implies that these series are not stationary at levels i.e. first-difference of this series is mean reverting and stationary. Then, the series is integrated of order one i.e. I(1).
However, revenue from oil proceeds (OLR) is stationary at level i.e. integrated at order zero [I(0)]. Thus, it was found not to reject the null hypothesis "no stationary" at level but after several iterations based on the number of lag length and differencing, the series were found to reject the null hypothesis at first difference. This indicates that the first-difference of those series is mean reverting and stationary.
10. Global Journal of Management and Business Research
Volume XV Issue X Version I Year 2015
11. ( B )
Oil Revenue, Government Expenditure and Poverty Rate in Nigeria The cointegration result presented in Table 4.2 indicated that the estimated residual (ECM) from the main empirical model was found to be stationary at level. This indicates that the null hypothesis "no cointegration" was rejected at 5% significance level. This implies that there exist long-run relationships among government capital expenditure (GCE), gross capital formation (GCF), gross domestic product (GDP), government recurrent expenditure (GRE), revenue from oil proceeds (OLR) and poverty rate (POV) in Nigeria between 1970 and 2013. Thus, there is long-run relationship between all the incorporated government expenditure, proceeds from oil and poverty rate in Nigeria.
The cointegrating equation was estimated using the ordinary least squares (OLS) method and the long-run estimates were presented on Table 4.3. The estimates of the long-run model that captures the effect of macroeconomic variables contribution (such as government expenditure and oil revenue) on poverty rate in Nigeria between 1970 and 2013 indicated that gross domestic product (GDP) and revenue from oil proceeds (OLR) exert negative effect on poverty rate (POV) in Nigeria during the reviewed period. They were found to be in tandem with theoretical expectation as they were able to reduce poverty in Nigeria. In magnitude term, a percentage change in gross domestic product (GDP) and revenue from oil proceeds (OLR) reduce poverty rate by 1.41% and 5.65% respectively. However, only revenue from oil proceeds has significantly impact poverty rate by 5% significance level. On the other side, government capital expenditure (GCE), gross capital formation (GCF), and government recurrent expenditure (GRE) were found to have positive effect on poverty rate (POV) in Nigeria as these effects do not conform with a'priori expectation. Correspondingly, a percentage increase in government capital expenditure (GCE), gross capital formation (GCF), and government recurrent expenditure (GRE) deteriorate poverty level in Nigeria by 8.25%, 3.03% and 2.49%. The result shows that the estimated parameters of government capital expenditure (GCE) and gross capital formation (GCF) were found to be partially and statistically significant at 5% critical level because their p-values are less than 0.05.
Thus, the F-statistic result indicated that all the incorporated government expenditure and oil revenue indicators are simultaneously significant at 5% critical level. This prompts the rejection of the null hypothesis "oil revenue and government expenditure have no significant effect on poverty rate in Nigeria". More so, the adjusted R-squared result reveals that 91.4% of the total variation in poverty rate (POV) is accounted by changes in government capital expenditure (GCE), gross capital formation (GCF), gross domestic product (GDP), government recurrent expenditure (GRE), revenue from oil proceeds (OLR) during the review period. The Durbin-Watson test result reveals that there is presence of strong positive serial correlation among the residuals, because of the d-value (1.8448) is less than two.
However, the Breusch-Godfrey serial correlation test result from table 4.2 reported that we do not reject the null hypothesis "no serial correlation" at 5% significance level, and likewise for the Breusch-Pagan-Godfrey heteroskedasticity test, the result indicated that we do not reject the null hypothesis "no hereroskedasticity" at 5% significance level.
The table also reports the probability value of the Jarque-Bera statistic (0.1439) shows that the estimated residual series is normally distributed with zero mean and constant variance. This tends to improve the reliability of the estimated parameters and thus, necessitate other residual diagnostic test such as higher order serial correlation and heteroskedasticity tests.
12. c) Granger Causality Analysis
The pair-wise Granger causality test results of the relationship between oil revenue, government expenditure and poverty rate in Nigeria from 1970 to 2013 were presented on Table 4.4. The test result indicated that on the basis of the F-statistic values, the null hypotheses that "each of gross capital formation (GCF), gross domestic product (GDP), and government recurrent expenditure (GRE) does not Granger cause poverty rate (POV)" were not rejected at either 5% and 10% critical levels. This implies that investment, income and recurrent expenditure by government do Granger cause poverty rate in Nigeria. This denotes a uni-directional causation from investment, income and recurrent expenditure by government to poverty rate. Contrary to the above findings, a uni-directional causation runs from poverty rate to oil revenue. Considering capital expenditure by government, it has no causal relationship with poverty rate, and no feedback was also reported.
Other null hypothesis i.e. GCE does not Granger Cause GCF; GCE does not Granger Cause GDP; and GCE does not Granger Cause GRE were rejected at either 5% or 10% significant level, signifying a uni-directional causal relationship. In addition, these variables i.e. GCE do not Granger Cause OLR; GCF does not Granger Cause GDP; GCF does not Granger Cause GRE; OLR does not Granger Cause GCF; GRE does not Granger Cause GDP; OLR does not Granger Cause GDP; and OLR does not Granger Cause GRE report a bi-directional causal relations at varying significant levels.
13. VI.
14. Conclusion and Policy Options
This study critically examined the precise relationship among oil revenue, government expenditure and poverty rate in Nigeria between 1970 and 2013. During this time period, the Nigerian economy has undergone series of economic reforms over the years. The ordinary least squares (OLS), diagnostic tests and Granger causality test were carried out as econometric methods of estimation. Empirical result disclosed that gross domestic product and revenue from oil proceeds exert negative effect on poverty rate in Nigeria during the reviewed period. This revealed that oil proceeds being the main revenue source in Nigeria have greater impact in ensuring equal distribution of income as a means of reducing poverty level among her citizens. It further shows the high dependency of government on oil as this serves as a medium through which eradication of poverty can be achieved. Painstakingly, these proceeds are not channelled into the right direction as government spending on capital projects and recurrent expenditure further enhance poverty level in Nigeria. On this note, there is need for effective management of government spending in Nigeria as continuous increase in her expenditure on both capital and recurrent items are needed to bring down the level of poverty in Nigeria. Furthermore, the Granger causality test reports a bi-directional causal relationship from investment, income and recurrent expenditure by government to poverty rate. This however confirms the effectiveness of government spending towards poverty reduction. More so, poverty rate was found to Granger cause oil revenue. It implies that if poverty rate is not tackled, revenue from oil proceeds may decline as insecurity will affect the activities of oil companies in the oil-producing regions. For example, the crisis in the Niger-Delta has been a major obstacle to crude oil production over the years.
15. VII.
© 2015 Global Journals Inc. (US) 1


| Series | T-ADF Statistics | Order of Integration | ||||||||||||||||
| GCE | -4.4899 (1) -4.1985* | 1 | ||||||||||||||||
| GCF | -4.6903 (1) -4.1985* | 1 | ||||||||||||||||
| GDP | -3.4463 (1) -3.1929** | 1 | ||||||||||||||||
| GRE | -4.5678 (1) -4.1985* | 1 | ||||||||||||||||
| OLR | -6.5038 (8) -3.6329 | 0 | ||||||||||||||||
| POV | -4.9829 (0) -3.5966 | 1 | ||||||||||||||||
| Note: *, ** & *** denote and 10% significant level respectively. | ||||||||||||||||||
| Source: Author's computation (2015). | ||||||||||||||||||
| Subsequently, econometric literature has indicated that linearly combining or regressing a non-stationary series on non-stationary and stationary time series might yield spurious regression and render estimated parameters inefficient. Thus, this argument prompts the cointegration test to examine if the linear combination of our considered poverty rate determinants. the Engle-Table 4.2 : Engle-Granger Cointegration Results b) Cointegration, Long-Run Estimates and Diagnostic Test The long-run relationship between macroeconomic variable and poverty rate determinants in Nigeria between 1970 and 2013 was examined using | ||||||||||||||||||
| ADF Test at Level | ||||||||||||||||||
| Series | T-ADF Statistics | Critical Value | Decision | |||||||||||||||
| ECT | = | u | = | POV | ? | ? ? ? ? | + ? | + GCE GRE 1 ? 4 + ? | + ? | OLR GCF 2 ? 5 | + | ? | 3 | GDP | ? ? ? ? | 1% level: -3.5925 5% level: -2.9314 10% level: -2.6039 | -3.3378 (0.0192) | Stationary i.e. Cointegrated |
| Source: Author's computation (2015). | ||||||||||||||||||
| Dependent Variable: POV | ||||
| Method: Least Squares | ||||
| Observation (n) = 44 | ||||
| Variable | Coefficient | Std. Error | Tstatistics | Prob. |
| C | -36.6651 | 46.0044 | -0.7969 | 0.4304 |
| Gce | 8.2453 | 1.8634 | 4.4249 | 0.0001 |
| Gcf | 3.0290 | 0.6904 | 4.3872 | 0.0001 |
| Gdp | -1.4063 | 2.8799 | -0.488 | 0.6281 |
| Null Hypothesis: | Obs F-Statistic Prob. | ||
| GCE does not Granger Cause POV | 42 | 1.28273 | 0.2893 |
| POV does not Granger Cause GCE | 1.34733 | 0.2724 | |
| GCF does not Granger Cause POV | 42 | 3.97153 | 0.0274 |
| POV does not Granger Cause GCF | 1.11015 | 0.3402 | |
| GDP does not Granger Cause POV | 42 | 2.98023 | 0.0631 |
| POV does not Granger Cause GDP | 0.61625 | 0.5454 | |
| GRE does not Granger Cause POV | 42 | 2.84088 | 0.0712 |
| POV does not Granger Cause GRE | 1.83265 | 0.1742 | |
| OLR does not Granger Cause POV | 42 | 0.40500 | 0.6699 |
| Year 2015 |
| 18 |
| ( B ) |
| © 2015 Global Journals Inc. (US) 1 |