1. Introduction
aving is normally considered in economics as disposable income minus personal consumption expenditure. In other words, it is regarded as income that is not consumed by immediately buying goods and services. For the purpose of this study, it must be emphasized that "saving" refers to deposits in saving accounts. Thus, the studies focus on financial saving of households held by banks and microfinance institutions (Issahaku, 2011).
Generally, savings outlets where rural households deposit their savings are of two main types: formal and informal financial institutions (Ahmad et al, 2006). Formal savings outlets include commercial banks, mobile banking or daily savings enterprise, microfinance and micro credit banks and the informal savings outlets include mutual savings, Susu and selfsaving which basically involves keeping the money at home or with a trusted member of the community. Susu is a form of saving undertaken by a group of people with a common interest. The group could consist of coworkers, traders in the same area or even neighbors who agree to make contributions periodically (daily, weekly or monthly) and the total sum is given to one of The study is structured as follows. Following the introduction, 'section 1' shows objectives, hypothesis and methodology, 'section 2' says the limitations of this paper, 'section 3' has the literature review, 'section 4' consists of analysis and findings, recommendations and conclusions are in 'section 5' and 'section 6' offers references.
2. a) Objectives
The main objective of this paper is to discover the influencing components of human saving behavior. The subsequent objective is to measure the relationship between the influencing components and saving fascination.
3. b) Hypothesis H 0 :
There is no significant relationship between the influencing components of human saving behavior and saving fascination. H 1 : There is significant relationship between the influencing components of human saving behavior and saving fascination.
4. c) Data Sources and Methodological Issues
The present study is basically based on primary data. These primary data have been collected from the Sylhet City during June 2015 to November 2015. The depositors from different banks and non-banking financial institutions have been addressed in this study. The sampling population of this study includes 350 depositors from Sonali Bank Ltd (50), Trust Bank Ltd(50), Modhumoti Bank(50), City Bank(50), United Commercial Bank Ltd(50), AB bank Ltd(50), National Bank Ltd(25), IDLC Finance Limited(25) in the Sylhet City. This study followed the random sampling method representative population. The primary data have been collected by using a highly structured questionnaire which contain two parts: Part 1 demographic information and part 2 influencing components of human saving behavior.To find out the influencing components of Year 2015
5. ( B )
Abstract-Saving can be defined as difference between individual's disposable income and its consumption. Saving is the normal human nature. This study aims at identifying some important components which influence human saving behavior. 350 depositors from the different banks of Sylhet City in Bangladesh. Several tools (Descriptive Statistics, Factors Analysis and Multiple Regression Analysis) have been used to find out core cause of human savings. The researcher has found at least 15 components that influence human saving behavior. So there have been 1 dependent variable i.e., saving fascination and 15 different independent variables i.e., to be rich man, to buy durable goods, Children education, to travel in future, etc. The findings of the study reveal five core components which influence human saving behavior mostly i.e., to have enough social security, to earn profit, for some dependent persons, to be rich man and to travel in future. This propensity of individual saving behavior to financial institutions leads to the development of a country's economic strengths because as many people save as much as financial institutions provide loans to the development projects. the members at a time at the end of a defined period (usually a month) until the cycle goes round every member (Obi-Egbediet at, 2014). Classical regards capital accumulation as the key to economic progress. They, therefore, lay emphasis on larger savings. They are of opinion that only capitalists and landlords are capable of saving. The working class is incapable of saving because it gets wages equal to the subsistence level (Rehmanet al, 2011). human saving behavior, fifteen components have been considered as independent components and only one component is considered as dependent component that is saving fascination. These fifteen components are rated by Five Points Likert Scale. These are: 1=Strongly Dissatisfied, 2=Dissatisfied, 3=Average, 4=Satisfied, 5=Strongly Satisfied. To verify the collected data relating to influencing components several statistical analyses i.e., Descriptive Analysis, Factors Analysis and Multiple Regression Analysis have been conducted. All the econometric problems like auto correlation and Multicollinearity are checked. The researcher has used SPSS 20 software to analyze these analyses. The researcher has refereed to various books, journals and periodicals as the vital source of secondary data.
There are a number of determinants of saving. The level of savings depends on various factors such as income, interest rates, fiscal factors, demographics factors as well as psychological, cultural and social factors. Among the economic factors the interest rate is also considered as an important factor affecting the level of savings. The demographic variables like percentages of children and old people are very important determinants of savings (Fraczek, 2011). Middle-aged people tend to have higher incomes with lower propensities to consume and higher propensities to save. He argued also that there is a positive relation between income and saving for poor countries (Deaton, 2005). According to (Shem, 2002) Burney and Khan (1992) explained that various socio economic and demographic factors as determinants of savings. Impact of Income, earning status, occupation, and age square of household head on saving were appeared to be positive but inverse of household income, dependency ratio, education, employment status, secondary earner and age were inversely related to savings of urban and rural households.Rogg, (2000) said that according to economic theory, credit access is expected to have several influences on savings: impatient consumers will be tempted to borrow and consume more in the present, hence save less; some current savers will reduce their saving since future needs can be financed more easily through credit; no change in saving will occur for the very patient and highly risk-averse savers.
6. Global Journal of Management and Business Research
7. Limitations
The major limitations are:
2. These data have been collected from Sylhet region. So, actually it cannot be representing the actual saving behavior of human. 3. Some people are unwilling to provide information because they are worried about tax related issues. 4. It is presumed that the people, who has an account, has a habit of saving.
8. III.
Literature Review earner, sex, consumption pattern etc. have been studied over saving pattern.
1. Different people have different opinions, different adoptions and different saving behaviors.
Saving is the normal nature of human because everyone is conscious about his future. To be safe in future they can make savings. They can spend these savings in the rainy day. There are some variables which influence to saving. Saving is one of the important variables for economic growth of any country. Saving is about income that is not consumed by immediately buying goods and services (Manyama, 2007). Abid and Afridi, (2010) showed in their paper thatsaving is an important variable in the theory of economic growth. Several studies have been conducted to assess saving behavior. These studies include Qureshi (1981), Giovanni (1983), Khan (1988), Burney and Khan (1992) The researcher has shown how independent variables hypothetically affect the dependent variables.
IV. More mean and less standard deviation is the important component of influencing the human saving behavior. Here, it is clear that 'Social Security' is the main and most important component that influences human to have the saving behavior. Then important components are 'Wish to get good profit', 'For dependent persons', and 'To be rich man'. Less important components are 'There have a chance of future unemployment' and 'To have enough credit access'. Here, for 16 items (including dependent component), Cronbach alpha is 0.790 which is greater than 0.70 and less than 0.90. That means the researcher has used highly reliable data for analysis.
9. Analysis and Findings a) Demographic Information
10. d) Sample Adequacy and Sphericity Test
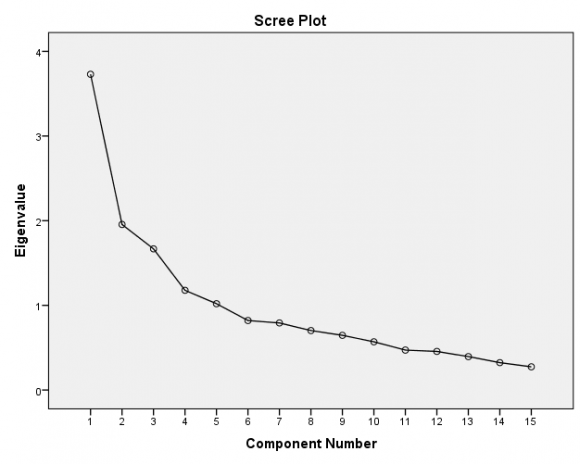
The researcher will do the factor analysis. For this reason, it is needed to know the suitability of dataset for factor analysis (Principle Component Analysis). The following table 4 (Table 4) gives information about sample sufficiency index ??? by Kaiser-Meyer-Olkin, which compares the sizes of the observed correlation coefficients to the sizes of the partial correlation coefficients for the sum of analysis variables is (0.706) 70.6%, and it is reliable because it overcomes (0.70) 70% by far (cut-off above 0.50) (Yong, In addition, supposition test of sphericity by the Bartlett test (H 0 : There is no significant relationship between the influencing components of human saving behavior and saving fascination.) is rejected on a level of statistical significance p<0.0005 for Approx. ChiSquare = 1370.085. Consequently, the coefficients are not all zero, so the second acceptance of factor analysis is satisfactory (Anastasiadou, 2011). As a result, both acceptances for the conduct of factor analysis are satisfactory and it can proceed with it. e) The Scree Plot Graph The Scree plot shows the graphical representation of eigenvalues and guides to determine the essential factorial axis. The criterion of eigenvalue or characteristic root (Eigenvalue) ?1 was used for defining the number of the factors (Kaiser, 1960). The above figure shows that the distinguished break up to the fifth factors, whereas after the fifth factor an almost linear part of the eigenvalue curve follows.
11. Global Journal of Management and Business Research
Here only five factors have eigenvalue over 1.00 i.e., 3.729, 1.955, 1.667, 1.178, and 1.020 for the 1st, 2nd, 3rd, 4th and 5th factor respectively. (Table No. 5) and decide whether they interpret data in a satisfactory way. The communalities in the Extraction column reflect the common variance in the data structure or the proportion of variance explained by the underlying factors. i.e., 65.70% of variance associated with question 1 (Component 1 i.e., Enough credit access) is common, or shared, variance. The common communality table shows that each question has the Extraction value more than 0.50 which represent the satisfactory quality of the measurements from the model of 5 factors (Anastasiadou, 2011). By the use of SPSS Principle Component Factor Analysis, it is clear that total 15 components can be divided 5 groups of new components. i.e., Factor 1 named 'Social security with rich' contains components of 'Social security, wish to earn good profit, to be rich man, travel in future and for dependent persons'. Factor 2 named 'Children education with purchase durable goods and land' contains components of 'children education, want to purchase durable goods and want to purchase land'. Factor 3 named 'Credit and pension scheme' contains components of 'Liabilities to pay, to have enough credit access and provision for pension scheme'. Factor 4 named 'Chance of future unemployment with old age facilities' contains components of 'Chance of future unemployment and facilities in old age', and factor 5 named 'Remittance with saving scheme' contains components of 'Suitable saving scheme and remittance access'.
In summary, Social security with rich, Children education with purchase durable goods and land, Credit and pension scheme, Chance of future unemployment with old age facilities and Remittance with saving scheme, these five factors can explain 63.662% of total variance.
12. f) Research Model
The researcher has found 5 important components that influencing human saving behavior. Now researcher has tried to know the significant impact of these components on saving fascination. So the researcher has decided to conduct multiple regression analysis. The regression model is:
Y= ? + ? 1 F 1 + ? 2 F 2 + ? 3 F 3 + ? 4 F 4 + ? 5 F 5 + ?tWhere, Y= Saving fascination This Saving fascination can be affected by the following influencing components of save: F 1 = Social security with rich F 2 = Children education with purchase durable goods and land F 3 = Credit and pension scheme F 4 = Chance of future unemployment with old age facilities F 5 = Remittance with saving scheme ?t= Error Term And ? is constant and ? 1 , ? 2 , ? 3 , ? 4 , and ? 5 , are coefficient of estimate. From table no. 8 it is seen that there is a significant correlation between independent variables and dependent variables. At the level of 5% significant, the correlation is 59.4% which shows the moderate relation because the value of R is between 0.40 to 0.60. The value of R ANOVA output indicates that regression equation is explaining a statistically significant portion of the variability in the dependent variable from the variability of independent variables. This table also tells that the regression model is statistically highly significant (F test is highly significant, p=0.000 which is p<0.05). Thus it can be said that "H 0 : There is no significant relationship between the influencing components of g) Parameter Estimates and Multicollinearity This table shows the value of predictor variables and intercept i.e., the value of ?, ? 1 , ? 2 , ? 3 , ? 4 , and ? 5. Here constant (?) is 3.820. Factor 1-The coefficient for Factor 1 is .025. So for every unit increase in Factor 1, a 0.025-unit increase in saving is predicted, holding all other variables constant. Factor 2-The coefficient for Factor 2 is .196. So for every unit increase in Factor 2, a 0.196-unit increase in saving is predicted, holding all other variables constant.
Factor 3-The coefficient for Factor 3 is .514. So for every unit increase in Factor 3, a 0.514-unit increase in saving is predicted, holding all other variables constant. Factor 4-The coefficient for Factor 4 is .212. So for every unit increase in Factor 4, a 0.212-unit increase in saving is predicted, holding all other variables constant. Factor 5-The coefficient for Factor 5 is .063. So for every unit increase in Factor 5, a 0.063-unit increase in saving is predicted, holding all other variables constant.
13. Global Journal of Management and Business Research
Volume XV Issue XI Version I Year 2015
14. ( B )
Influencing Components of Human Savings Behavior in Sylhet City human saving behavior and saving fascination" is rejected and accept "H 1 : There is significant relationship between the influencing components of human saving behavior and saving fascination." Hence, ANOVA output supports the research hypothesis that there is a statistically significant relation between the set of independent variables and dependent variables.
Third column shows the values for the standard errors associated with these coefficients and factor 2, 3, 4 are statistically significant.
Finally, the research equation should be as follows: Y= 3.820 + 0.025F 1 + 0.196F 2 + 0.514F 3 + 0.212F 4 + 0.063F 5 + ?t
The researcher has also tried to know, whether there is any multicollinearity problem in the regression model. So, it can be conducted through Collinearity Statistics. A VIF around 1 is very good. (The minitab blog, 2015) A rule of thumb is that if VIF>10 then multicollinearity is high (Kutner et al, 2004). So there have no any muli-collinearity problem in this model and the model is good in shape.
15. V. Recommendation and Conclusion
Capital is the result of saving, and savings come from less present consumption for the sake of future goods. For having the economic development, it needs to formulate capital. These capital formation is possible though increased saving behavior from the people. According to (Gedela, 2012) from the classical times, saving has been considered as one of the determinants of growth. To lead the underdeveloped countries to the path of development, rate of savings must be enhanced. For the individuals and households, savings provide a cushion of security against future contingencies, whereas for the nation, savings provide the funds needed in the developmental efforts. To achieve higher rate of growth with relative price stability, the marginal propensity to save should be raised by appropriate incentives and policies. Also, in an era of international financial integration, for macroeconomic stability, higher domestic savings are essential.
So, it is clear that saving is one the most important factors for the developing country to be more developed. In this paper, the researcher has tried to find out cause of human saving behavior. Researcher has found a lot of variables that influencehuman savings behavior. But all variables are not applicable for everyone. For this reason, the researcher has taken only 15 variables. But these 15 variables are not enough because these variables explained only 35.3% variations. So there has a research gap. There should have been more variables to explain the cause of human saving. Here the researcher has found the main cause of human saving is that the having future security. So, financial institutions and government should take some initiatives regarding these variables of savings. Financial institutions can open new policy (scheme) for security purpose and enhance interest rate. As a result, the people will save more than previous time. If the people save more, there will be more development (Ahsan, 2015).


| a) Conceptual Framework |
| Influencing Components of Human Savings Behavior in Sylhet City | ||||||||
| Graduate | 138 | 39.4 | ||||||
| Postgraduate | 106 | 30.3 | ||||||
| Others | 16 | 4.6 | ||||||
| Total | 350 | 100 | ||||||
| 6 | Marital Status | |||||||
| Married | 249 | 71.1 | ||||||
| Unmarried | 101 | 28.9 | ||||||
| Total | 350 | 100 | ||||||
| Source: Author's analysis of research data, 2015 | ||||||||
| Year 2015 | From the above table the researcher has found that males (74.3%) are more than females in number. Most of them are in the age group of 31 to 40 (50.3%), b) Influencing Components of Human Savings Behavior | employed (43.1%), graduate (39.4%) and married (71.1%). | ||||||
| 16 | Table No. 2 : Descriptive Statistics | |||||||
| Descriptive Statistics | ||||||||
| N | Mean | Std. Deviation Variance | ||||||
| social security | 350 | 3.8114 | .88857 | .790 | ||||
| good profit | 350 | 3.7343 | .81583 | .666 | ||||
| dependent persons | 350 | 3.6943 | 1.05750 | 1.118 | ||||
| to be rich man | 350 | 3.6800 | .86670 | .751 | ||||
| travel in future | 350 | 3.6486 | 1.02375 | 1.048 | ||||
| facility in old age | 350 | 3.6400 | 1.08208 | 1.171 | ||||
| children education | 350 | 3.6343 | 1.18635 | 1.407 | ||||
| buy durable goods | 350 | 3.5400 | 1.12148 | 1.258 | ||||
| ( B ) | S. No. purchase land Demographic Profile 350 1 Gender Male liabilities to pay 350 provision for pension scheme 350 | Number 3.5371 260 3.2314 3.1686 | 1.22418 Percentage 1.499 74.3 1.11547 1.244 1.10877 1.229 | |||||
| Female remittance access | 350 | 90 3.0829 | 1.23997 | 25.7 | 1.538 | |||
| Total suitable saving scheme 2 enough credit access Age Groups 20 to 30 chance for future unemployment | 350 350 350 | 350 3.0057 2.9629 89 2.8371 | 1.04070 1.08720 1.28438 | 100 25.4 | 1.083 1.182 1.650 | |||
| 31 to 40 Valid N (listwise) | 350 | 176 | 50.3 | |||||
| 41 to 50 Source: Author's analysis of research data, 2015 | 67 | 19.1 | ||||||
| 51 and above | 18 | 5.1 | ||||||
| Total | 350 | 100 | ||||||
| 3 | Employment Status | |||||||
| Employed | 218 | 62.3 | ||||||
| Unemployed | 132 | 37.7 | ||||||
| Total | 350 | 100 | ||||||
| 4 | Profession | |||||||
| Employee | 151 | 43.1 | ||||||
| Businessman Student For having high quality research results, it is c) Reliability and Validity Test needed to have valid and reliable data collection | 83 67 | 23.7 19.1 | ||||||
| Others | 49 | 14.0 | ||||||
| Total | 350 | 100 | ||||||
| 5 | Level of Education | |||||||
| Undergraduate | 90 | 25.7 | ||||||
| © 2015 Global Journals Inc. (US) 1 | ||||||||
| 4 : Sample Adequacy and Sphericity Test | ||
| KMO and Bartlett's Test | ||
| Kaiser-Meyer-Olkin Measure of Sampling Adequacy. | .706 | |
| Approx. Chi-Square | 1370.085 | |
| Bartlett's Test of Sphericity | df | 105 |
| Sig. | .000 | |
| Table No. 6 : Communalities | |||||||||
| Communalities | |||||||||
| Initial | Extraction | ||||||||
| enough credit access | 1.000 | .657 | |||||||
| liabilities to pay | 1.000 | .748 | |||||||
| Year 2015 | provision for pension scheme purchase land chance for future unemployment | 1.000 1.000 1.000 | .531 .701 .690 | ||||||
| 18 | buy durable goods | 1.000 | .680 | ||||||
| children education | 1.000 | .700 | |||||||
| Volume XV Issue XI Version I | Total Variance Explained remittance access 1.000 suitable saving scheme 1.000 dependent persons 1.000 to be rich man 1.000 good profit 1.000 social security 1.000 facility in old age 1.000 travel in future 1.000 | .486 .766 .666 .516 .611 .690 .583 .523 | |||||||
| ( B ) | Component | Initial Eigenvalues | Extraction Sums of Squared | Rotation Sums of Squared | |||||
| Global Journal of Management and Business Research | 1 2 3 4 5 6 7 8 9 10 11 | Total 3.729 1.955 1.667 1.178 1.020 .821 .792 .703 .646 .569 .472 | % of Variance 24.863 13.036 11.114 7.853 6.797 5.472 5.281 4.684 4.307 3.796 3.146 | Cumulative % 24.863 37.899 49.013 56.866 63.662 69.134 74.415 79.099 83.405 87.201 90.347 | Total 3.729 1.955 1.667 1.178 1.020 | Loadings % of Variance Cumulative % 24.863 24.863 13.036 37.899 11.114 49.013 7.853 56.866 6.797 63.662 | Total 2.249 2.035 1.898 1.700 1.668 | Loadings % of Variance Cumulative % 14.990 14.990 13.569 28.559 12.652 41.211 11.330 52.541 11.121 63.662 | |
| 12 | .456 | 3.038 | 93.385 | ||||||
| 13 | .395 | 2.632 | 96.017 | ||||||
| 14 | .323 | 2.156 | 98.173 | ||||||
| 15 | .274 | 1.827 | 100.000 | ||||||
| Extraction Method: Principal Component Analysis. | |||||||||
| © 2015 Global Journals Inc. (US) 1 | |||||||||
| remittance access | .598 | |||
| Extraction Method: Principal Component Analysis. | ||||
| Rotation Method: Varimax with Kaiser Normalization. | ||||
| a. Rotation converged in 7 iterations. | ||||
| Source: Author's analysis of research data, 2015 | ||||
| Year 2015 | ||||
| Volume XV Issue XI Version I | ||||
| ( B ) | ||||
| social security good profit to be rich man travel in future dependent persons children education buy durable goods purchase land liabilities to pay enough credit access | 7 : Rotated Component Matrix Rotated Component Matrix a Component 1 2 3 .756 .732 .640 .551 .476 .808 .806 .588 .405 .841 .778 | 4 -.446 .434 | 5 .462 | Global Journal of Management and Business Research |
| provision for pension scheme | .527 | |||
| chance for future unemployment | .791 | |||
| Model Summary b |
| Influencing Components of Human Savings Behavior in Sylhet City | |||||||||
| facility in old age | Table No. 9 : Analysis of Variance | .639 | |||||||
| suitable saving scheme remittance access | ANOVA a | .837 .598 | |||||||
| Model | Sum of Squares | df | Mean Square | F | Sig. | ||||
| Regression | 108.481 | 5 | 21.696 | 37.471 | .000 b | ||||
| 1 | Residual | 199.179 | 344 | .579 | |||||
| Total | 307.660 | 349 | |||||||
| a. Dependent Variable: saving fascination | |||||||||
| b. Predictors: (Constant), A-R factor score 5 for analysis 1, A-R factor score 4 for analysis 1, A-R | |||||||||
| factor score 3 for analysis 1, A-R factor score 2 for analysis 1, A-R factor score 1 for analysis 1 | |||||||||
| Year 2015 | Source: Author's analysis of research data, 2015 | ||||||||
| 20 | |||||||||
| Volume XV Issue XI Version I | |||||||||
| ( B ) | |||||||||
| Global Journal of Management and Business Research | Model 1 | R .594 a | R Square .353 | Adjusted R Square .343 | Std. Error of the Estimate .76093 | Durbin-Watson 1.663 | |||
| 64.7% of variance can be explained by the other | |||||||||
| variables. The Durbin-Watson d=1.663, which is | |||||||||
| between the two critical value 1.5<d<2.5 and therefore | |||||||||
| it can assume there is no first order liner auto-correlation | |||||||||
| in these multiple liner regression model (Statistics | |||||||||
| Solution, 2015). | |||||||||
| © 2015 Global Journals Inc. (US) 1 | |||||||||
| Coefficients a | ||||||||
| Model | Unstandardized | Standardized | t | Sig. | Collinearity | |||
| Coefficients | Coefficients | Statistics | ||||||
| B | Std. Error | Beta | Tolerance VIF | |||||
| (Constant) | 3.820 | .041 | 93.919 | .000 | ||||
| A-R factor score 1 for analysis 1 | .024 | .041 | .025 | .579 | .563 | 1.000 | 1.000 | |
| A-R factor score 2 for analysis 1 | .184 | .041 | .196 | 4.515 | .000 | 1.000 | 1.000 | |
| 1 | A-R factor score 3 for analysis 1 | .483 | .041 | .514 | 11.855 | .000 | 1.000 | 1.000 |
| A-R factor score 4 for analysis 1 | .199 | .041 | .212 | 4.898 | .000 | 1.000 | 1.000 | |
| A-R factor score 5 for analysis 1 | .059 | .041 | .063 | 1.451 | .148 | 1.000 | 1.000 | |
| a. Dependent Variable: saving fascination | ||||||||
| Source: Author's analysis of research data, 2015 | ||||||||