1. Introduction
he microfinance lending models that currently dominate the microfinance industry are joint and the individual lending models (Attanasio et al., 2013). Following the success of the Grameen Bank in Bangladesh, a large number of microfinance institutions all over the world have replicated the "Grameen model" of joint liability lending (Kono, 2006). Therefore, joint liability model is the main lending model used by microfinance institutions to lend to poor people who lack conventional collateral (Maurya, 2011). This lending model allows the poor people to 2 access credit by substituting social capital for physical capital because the joint liability acts as collateral (Barboni et al., 2013). However, despite the many celebrated facets of joint liability lending, some research reveals that joint liability creates excessive social pressure on group members and discourages good clients from borrowing (Giné and Karlan, 2011; Attanasio et al., 2013).
When an individual borrow incurring joint liability, there is spreading of risk i.e. risk is shared amongst a group"s members (Sugden and William, 1983). Therefore, group members are jointly liable for repayment of the loan for each group member (Armendáriz and Morduch, 2010). However, some research reveals that in joint liability borrowing other borrowers does not repay the loan because she believes that another client will pay it for her, and the microfinance institutions are indifferent because they still get their money back (Barboni et al., 2013;Giné and Karlan, 2010). This discourages good clients from borrowing (Wydick et al., 2007). According to Giné and Karlan (2010), the majority of joint borrowers dislike the tension caused by the joint liability model. However, in other cultures, joint liability has been found to be more successful, where a borrower found borrowing partners whom s/he personally trusted (Wydick et al., 2007).
Theorists like Rogers (1983), Meyer and Allen (1997) state that innovations that have a clear and unambiguous advantage or have cost-effectiveness are more easily adopted. Nevertheless, relative advantage alone does not guarantee widespread adoption (Hassan et al., 2010). Some innovations are never adopted at all; others are adopted and subsequently abandoned (Vannoy and Palvia, 2010). In many cases the reason is that there is an issue of perceived risk that influences adoption intention (Davis et al., 1989). Every technology has some inherent risk (Davis, 1989). Although there are inherent risks in a technology, nonetheless individuals adopt technology when they feel that the benefits provided by the technology outweigh the costs involved in adopting the technology (Ibid). Davis (1989) using Technology Acceptance Model (TAM) found that risk associated with the use of technology may adversely affect the users. TAM has been considered as an excellent model in understanding individual"s perception on the use of the particular technology (Davis et al., 1989;Featherman and Pavlou, 2002;Pavlou, 2003) Researchers had applied TAM in other areas such as e-banking (Moga et al., 2012), consumer electronic commerce (Lui Kit and Jamieson, 2010), mobile banking services (Li and Yeh, 2010; Zhihong, 2010) etc. However, researchers have overlooked the use of TAM on microfinance institutions lending models. This study integrates Technology Acceptance Model (TAM) variables by Davis (1989) i.e. perceived usefulness, and perceived ease of use into the perceived risk, to examine their influence on borrowing decisions incurring joint vs. individual liability. There is theoretically an empirical support for integrating perceived risk with TAM variables. Pavlou (2003) integrated perceived risk with the TAM model. Featherman and Pavlou (2002) integrated perceived risk with TAM variables.
According to Gaskell et al. (2004) perceptions for the usefulness and ease of use reduce perceived risk and influence positively the adoption intention. Similarly, Pavlou (2003) found that perceived risk cause potential users to devalue perceived usefulness and perceived ease of use and affects negatively the adoption intention Therefore, this paper seeks to establish the relationship of the coefficient of the explanatory variable, whether the perceived risk associated with borrowing incurring joint liability has a negative effect on the decisions to borrow incurring joint liability or not.
2. II.
3. Literature Review a) Perceived Risk
It appears that there is no universally accepted definition of perceived risk (Jacoby and Kaplan, 1972;Mitchell, 1999). Perceived risk seems to emerge within two areas which are;
i. Risk and uncertainty (Bauer, 1960) and ii. Consequences (Weber and Bottom, 1989). Perceived risk has been defined differently according to the context of the study. The concept of perceived risk was originally introduced by Bauer in 1960. Thus, Bauer (1960) claims that consumer behavior involves risk, because the consequences of the product usage cannot be anticipated with certainty, and that some consequences of the product usage are likely to be unpleasant. Therefore, he defined perceived risk as the combination of uncertainty plus consequence of outcome. Similarly, Peter and Ryan (1976) conceived perceived risk as an influence on choice decisions and may be defined as the expectation of losses, associated with purchase and acts as an inhibitor to purchase behavior. They also conceptualized perceived risk as composed of two distinct components, the probability of loss and consequence or importance of that loss.
According to Gewald et al. (2006), perceived risk is generally defined as the undesired consequence outcome due to uncertainty about the future. As for Bauer (1960), risk is dissimilar to uncertainty because risk has a known probability while uncertainty does not. Similarly, Peter and Ryan (1976) recognized that uncertainty is different from perceived risk. However, Cunningham (1967) and Mitchell (1999) suggest that risk and uncertainty should be perceived as similar and should be acknowledged as risk rather than uncertainty, because buyers are unable to realize the exact probability of consequences.
On one hand, other studies suggest that perceived risk should be defined in terms of positive consequences (Arrow, 1965;Stone and Gronhaug, 1993). On the other hand, other studies argue that perceived risk should be defined as an aspect of negative consequences (Kogen and Wallack, 1964;Cox, 1967;Peter and Ryan, 1976). However, others studies defined perceived risk as a combination of positive and negative consequences (Weber and Bottom, 1989).
For instance, using the case study of the possibility of a win or loss in a lottery draw, perceived risk is defined as an alternative solution involving both positive (winning) and negative consequences (not winning) (Weber and Bottom, 1989). Defining perceived risk as a combination of positive and negative consequences appears to correspond with a borrower"s perception toward risk in general. However, for the purpose of this study, perceived risk can be considered as a negative consequences resulting from borrowing incurring joint liability.
4. i. The Facets of Perceived Risk
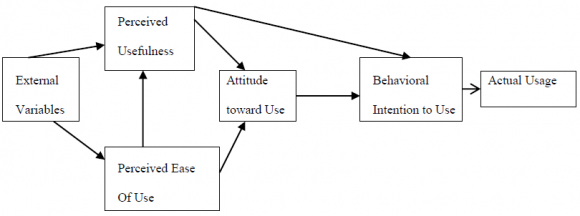
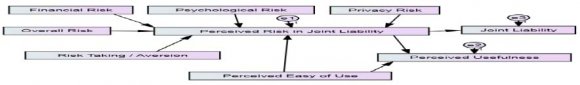
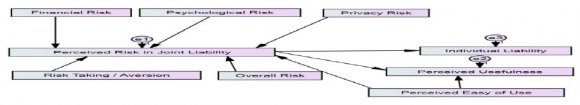
Perceived risk has been typified as having six dimensions: (1) performance risk, (2) financial risk, (3) time risk, (4) privacy risk, (5) social risk, and (6) psychological risk (Cunningham, 1967). Performance risk is the possibility of unavailable service or the service that cannot satisfy users or services that cannot function as expected (Zhihong, 2010). Financial risk refers to the possibility that the product will not be worth the financial price and would have 4 been available cheaper elsewhere (Azmi and Kamarulzaman, 2010). Furthermore, time risk is the possibility of the loss of time such as long period of transaction processing etc. (Zhihong, 2010). Privacy risk is the potential loss of control over personal information, such as when information about you is used without your knowledge or permission (Gewald et al., 2006). Social risk is the possibility of users who are not accepted or acknowledged by other people (Zhihong, 2010). Also Azmi and Kamarulzaman (2010) define social risk as an individual"s ego and the effect that adoption will have on the opinions of reference groups. Psychological risk is the possibility of mental stress of the users. This spirit pressure may come from the outside world such as the non-recognition of their friends and family, and may also come from themselves such as the irritable mood of financial losses when the response time of a certain type is too long (Azmi and Kamarulzaman, 2010). Overall risk is a measure of perceived risk when all criteria are evaluated together (Featherman and Pavlou, 2002). This study adopted five facets as antecedents of perceived risk in the research model (Figure 2.2) integrated by TAM variables to examine their influence in the adoption of joint vs. individual liability. Social risk was not adopted; the reason is explained in section 3.3 Davis (1989) i.e. perceived usefulness, and perceived ease of use integrated by perceived risk and its facets as a base theory. TAM has been applied in a more general context to a variety of (acceptance) decisions (Bartholomaus and Mayer, 2010). TAM as illustrated in Figure 2 ). External variables influence perceived usefulness (PU) and perceived ease of use (PEU). ? Perceived usefulness (PU): Perceived usefulness is defined as the extent to which a person believes the innovation developed is useful and will enhance his or her job performance. ? Perceived ease of use (PEU): Perceived ease of use is the extent to which a person believes that the developed technology will be free of effort. ? Attitudes towards use (A): Attitude towards use is defined as the user"s desirability of using the technology developed.
? Perceived usefulness (PU) and perceived ease of use (PEU) are the sole determinants of attitude (A) towards an adoption. Perceived usefulness and perceived ease of use is determined by external variables (EV) and attitudes toward use (A) can therefore be defined as: The theory claims that perceived risk cause potential users to devalue perceived usefulness and perceived ease of use and affects negatively the adoption intention (Pavlou, 2003). TAM has been applied in many other areas (Li and Yeh, 2010; Lui Kit and Jamieson, 2010; Zhihong, 2010; Moga et al., 2012). The question is whether TAM can also be applied in the area of microfinance institutions lending models. Thus the working hypothesis states that:
? A = PU + PEU + EV ? BehavioralPerceived risk in joint liability mediated by (a) perceived usefulness, (b) perceived ease of use influences negatively the decision to borrow as a group and positively as an individual. 6 III.
5. Methodology a) Study Area Selection Criteria
The study was conducted in four tribes within the country, the Chaga from Kilimanjaro Region, the Zaramo from Coast Region, the Kinga from Njombe Region and the Gogo from Dodoma Region borrowed from PRIDE (T) and FINCA (T). The selection of tribes, microfinance institutions and respondents were based on specific characteristics they possess, that are relevant to the purpose of this study. Therefore, sampling was guided by theoretical statistical sampling. Theoretical sampling means selecting a sample based on a certain characteristics they possess (Strauss and Cobin, 1998;Thompson, 1999). These tribes were selected for two reasons. The first consideration was the ethnic group where cooperation exists and secondly, the ethnic group where aggressiveness in business exist. Within the literature, the main factor in order for the joint liability model to operate well is the existence of trust associated with cooperation (Bohnet and Frey, 1999). Most of the loans from microfinance institutions are borrowed for business purposes (Moore, 1997). Therefore, differences in cultural values that exist among ethnic groups were the main reason for the selection of these ethnic groups.
Kilimanjaro Region which covers an area of 13,250 square kilometres is located in the North Eastern part of Tanzania Mainland. The region had a total population of 1,640,087 (URT, 2012). The first rationale for selecting the Chaga tribe from Kilimanjaro Region is that, the literature search shows that "Chaga people have the culture of cooperation (Conzales, 2005). The second rationale is its aggressiveness in business, as many of them are entrepreneurs (Ibid).
The Coast Region is located in the Eastern part of mainland Tanzania, and a large part of it is situated along the Indian Ocean costal belt. The region covers an area of 32,547 square kilometres. The region had a total population of 1,098,688 (URT, 2012). The first rationale for selecting the Zaramo tribe from the Coast Region is cooperation (Mazrui and Shariff, 1994). Zaramo culture has been influenced by the Arab culture which emphasizes safety of the group, (Bryceson, 2010). The second rationale is that the majority are not aggressive in business (Velten, 2002).
The Njombe Region which covers an area of 21,347 square kilometres is located in the South Western part of Tanzania Mainland. The region had a total population of 702,097 (URT, 2012). The rationale for selecting the Kinga tribe from Njombe Region is that they are known for their good business skills and cooperation among themselves (Iliffe, 2008). Dodoma Region is located in the Central part of mainland Tanzania. The region covers an area of 41,311 square kilometres. The region had a total population of 2,083,588 (URT, 2012). The rationale for selecting the Gogo tribe from Dodoma Region is that business is less conducted by the majority of Gogo people and cooperation is less among themselves (Narayan, 1997).
6. Global Journal of Management and Business Research
Volume XV Issue X Version I Year ( )
7. C
The study examines whether cooperation still exists for those tribes which have the culture of cooperation and does it make the joint liability an appropriate lending model. For the tribe which literature search shows that cooperation does not exists, the study examines whether joint liability is an appropriate lending model in accordance to their specific cultural settings. PRIDE (T) and FINCA (T) were selected for two reasons; first, they are microfinance institutions which have a wide outreach throughout the country as compared to other 7 microfinance institutions. Secondly, they are among the microfinance institutions whose methodology of lending, is based on both group and an individual lending.
8. b) Data Collection
The researcher met the respondents who borrowed using joint liability lending model at PRIDE (T) and FINCA (T). The selection of respondents, who participated in this study, was conducted using systematic sampling without replacement. The sample size for the study was 480 participants. This study used Structural Equation Modeling for the analysis (SEM). SEM requires a minimum sample size of 200 and above (Joreskog and Sorbom, 1993). A cross-sectional survey approach was employed through self-administered questionnaire. Before the actual survey, pre-testing of the questionnaire was done to check its relevance and appropriate modifications were made accordingly.
9. c) Quantification of the Variables
Perceived risk is the independent variables for this study. Perceived risk was measured in terms of the general risk toward borrowing incurring joint liability with the scale suggested by Miyazaki and Fernandez (2001). Cunningham (1967) typified perceived risk as having six dimensions: (1) performance risk, (2) financial risk, (3) time risk, (4) privacy risk, (5) social risk, and (6) psychological risk. The study used five risk facets to evaluate how perceived risk influenced borrowing decisions of incurring joint vs. an individual liability. The study did not use social risk because in the context of this study, social risk would have been based on people who did not borrow from microfinance institutions because they were unaccepted to join the group.
Perceived usefulness and perceived ease of use were the moderating variables for perceived risk measured from the scale adopted from Davis et al., (1989). Perceived usefulness contained questions measuring beliefs that using a particular system, may improve their business performances. Perceived ease of use contained questions which measured users" beliefs whether joint liability or individual liability was easier to use without difficulty. Joint vs. an individual liability are the dependent variables for this study. These were quantified by asking a question regarding borrowers" willingness to borrow incurring joint vs. an individual liability. Lehmann and Hulbert (1972) point out that if the focus is on individual behavior, five to seven point scales are used. Accordingly, these variables were measured using seven point Likert scale with end points of "strongly agree" (7) and "strongly disagree" (1).
10. d) Data Analysis
The preliminary data analysis was performed before testing the hypotheses of the study. Preliminary analysis involved factor analysis and models fit test.
The final data analysis tested the hypothesis of the study by the use of Structural Equation Modeling (SEM). In estimating the parameters under SEM, AMOS version 20 was used. AMOS was used because it is user friendly in terms of creating the structural models and defining the required statistics (Ame, 2005).
Therefore, once the model had attained an acceptable fit to the observed data, the causal path analysis or relationships among variables were determined. Path analysis was employed for studying the relationship between perceived risk and its facets moderating by perceived ease of 8 use and perceived usefulness and the decision to borrow incurring joint vs. an individual liability (see Figure 3 The validity and reliability of all the measures in the study instrument were improved qualitatively. This was done by employing a seven point Likert scale as suggested by Churchill and Peter (1984). Furthermore, the improvement was done by pre-testing the questionnaire and adoption of methods and instruments from past studies.
IV.
11. Results and Discussion
12. a) Respondents' Characteristics
The summary of respondents" features is given in Table 1. According to the results, some of the Chagga and Kinga ethnic groups prefer to borrow incurring joint liability, whereby from PRIDE (T), Chagga and Kinga ethnic groups were found to be 27% and 29% out of 93 and 85 9 respondents respectively. For the FINCA (T), Chagga ethnic group were found to be 17% out of 48 respondents while Kinga ethnic group were found to be 29% out of 51 respondents. However, for the Zaramo ethnic group none of them prefer to borrow incurring joint liability, from both PRIDE (T) and FINCA (T). For the Gogo ethnic group, out of 56 respondents, only 2% from PRIDE (T) prefers joint liability while for the FINCA (T), all of them prefer an individual liability. This is the challenge to the microfinance institutions because all of these borrowers borrow incurring joint liability. However, the majority of them prefer an individual liability. These findings suggest that joint borrowers perceived borrowing incurring joint liability as risky.
CWith respect to sex of the respondents, from PRIDE (T), out of 48 male respondents, 8% prefer joint liability while 92% prefer an individual liability. On the other hand, out of 232 female respondents, 20% prefer joint liability while 80% prefer an individual liability. From FINCA (T), out of 15 male respondents, 20% prefer joint liability while 80% prefer an individual liability. Likewise, out of 185 female respondents, 11% prefer joint liability while 89% prefer an individual liability. These findings indicate that regardless of whether the borrower is male or female, the majority prefer borrowing incurring an individual liability. These findings also suggest that the majority of the borrowers from microfinance institutions are women.
With respect to the ages of the respondents, from PRIDE (T), for the age group of 26 to 35, out of 57 respondents, 11% prefer joint liability while 89% prefer an individual liability. For the age group of 36 to 45, out of 150 respondents, 20% prefer joint liability while 80% prefer an individual liability. For the age group greater than 45 years, out of 73 respondents, 21% prefer joint liability while 79% prefer an individual liability. From FINCA (T), for the age group of 26 to 35, out of 46 respondents, 9% prefer joint liability while 91% prefer an individual liability. For the age group of 36 to 45, out of 113 respondents, 12% prefer joint liability while 88% prefer an individual liability. For the age group greater than 45 years, out of 41 respondents, 12% prefer joint liability while 88% prefer an individual liability. These findings indicate that despite of their differences in the age groups, the majority of the respondents prefer borrowing incurring an individual liability. These findings also suggest that the majority of the borrowers from microfinance institutions were in the 36 to 45 years range. These findings imply that the age groups of 36 to 45 years were dominant participants in the microfinance institutions, since they have reached maturity and have responsibilities in their families and society as a whole.
With regard to the level of education attained, from PRIDE (T), out of 23 respondents who have not attained any education, 13% prefer joint liability while 87% prefer an individual liability. For the respondents These findings suggest that despite of their differences in the level of education attained, the majority of the respondents from microfinance institutions prefer borrowing incurring an individual liability. These findings also suggest that the majority of the respondents were less educated people having attended primary school.
The results therefore suggest that it was the poorer part of the targeted population that benefited from the microfinance institutions.
With respect to marital status, from PRIDE (T), Table 1 has shown out that out of 251 married respondents, 18% prefer joint liability while 82% prefer an individual liability. For the divorced, out of 9 respondents, 22% prefer joint liability while 78% prefer an individual liability. For the cohabiting respondents, out of 20 respondents, 25% prefer joint liability while 75% prefer an individual liability. From FINCA (T), out of 177 married respondents, 10% prefer joint liability while 90% prefer an individual liability. For the divorced, out of 9 respondents, 33% prefer joint liability while 67% prefer an individual liability. For the widowed, out of 6 respondents, 33% prefer joint liability while 67% prefer an individual liability. For the cohabiting, out of 8 respondents, 100% prefer an individual liability. These findings suggest that 11 despite of their differences in marital status, i.e. whether the borrower is married, divorced, widowed or cohabiting, the majority of the respondents from microfinance institutions prefer an individual liability. These findings also suggest that the majority of the respondents were married people, because they have responsibilities in their families and society as a whole.
With regards to other training received, from PRIDE (T), out of 119 respondents who have received vocational training, 18% prefer joint liability while 82% prefer an individual liability. For the respondents who have not received any training, out of 161 respondents, 18% prefer joint liability while 82% prefer an individual liability. From FINCA (T), out of 68 respondents who have received vocational training, 13% prefer joint liability while 87% prefer an individual liability. For the respondents who have not received any training, out of 131 respondents, 11% prefer joint liability while 89% prefer an individual liability. In addition, only one respondent from FINCA (T) has received professional training and prefers an individual liability. These findings imply that regardless of whether the respondents have received training or not, the majority of the borrowers prefer an individual liability. Moreover, these findings also suggest that the majority of the respondents had not received any training. This is the challenge to the microfinance institutions, because poor people need business skills in order to be effective in expanding their business.
As far as the main occupation of the respondents was concerned, all of them were business people (100%). These findings imply that microfinance institutions targeted borrowers who are already engaged in business.
13. b) Preliminary Analysis i. Factor Analysis
For factor analysis, Tinsley and Tinsley (1987) suggest that, the larger the sample, the better. Comrey and Lee (1992) consider a sample of n ? 200 as appropriate for the factor analysis. Hence, n=280 from PRIDE (T) and n=200 from FINCA (T) were suitable for the analysis. To perform the factor analysis, principal components subjected to Oblimin rotation was used to allow for possible correlations between factors. The number of factors retained were those with initial Eigenvalues >1 (Bryman and Cramer, 2001). The results of the factor loading for PRIDE (T) and FINCA (T) reveal that most of the factors have high values of loadings ranging from 0.6 -0.9 suggesting that it is a well-defined structure Hair and colleagues (2005) as shown in Table 2 ii. Model Fit Test A Confirmatory factor analysis that is in the SEM was performed to test whether the data fit the hypothesized models. The intention is to confirm if the models are adequate enough to be used as the basis for testing the research hypotheses. For the findings to indicate that the predicted model is congruent with the observed data, it is recommended for the ?2 to be nonsignificant (p > 0.05), (Hoyle and Panter, 1995), CMIN/DF in the range of 2 to 1 or 3 to 1 indicate acceptable fit between the hypothetical model and the sample data (Kenny, 2012). Furthermore, for the hypothetical model to indicate acceptable fit to the sample data, the fit indices should be as follow; GFI>0.90, AGFI>0.90, CFI>0.90, TLI>0.90, NFI>0.90, IFI>0.90, RFI>0.90, RMR<0.05, RMSEA; good fit (0.00-0.05), fair fit (0.05-0.08), mediocre fit (0.08-0.10), and poor fit (over 0.10), PCLOSE should be > 0.05 to conclude close fit of RMSEA (Ibid). The models fit summaries-CMIN, CMIN/DF, RMSEA, GFI, AGFI, RMR, NFI, RFI, IFI, TLI and CFI, all indicate that the models serve as a good fit. The overall results of the models fit are as shown in Table 3 to 6 below.
14. c) Final Analysis
The summaries of the results of testing hypothesis for PRIDE (T) and FINCA (T) with the decision to borrow incurring joint liability are presented in Tables 7 and 8. This study has found out that the path coefficients for perceived risk were negative and significant (p ? 0.05), stronger in magnitude with ? = -1.09 for PRIDE (T) and ? = -0.71 for FINCA (T). These findings support the hypothesis that perceived risk in joint liability influenced negatively borrowing as a group. These findings imply that high perceived risk associated with borrowing incurring joint liability, drives borrowers negatively to prefer borrowing incurring joint liability. Likewise, the results reveal significance path coefficients for perceived risk and their measured variables (p ? 0.05) for both PRIDE (T) and FINCA (T), supporting the hypothesis that they influence negatively borrowing incurring joint liability. However, the path coefficients between perceived risk and time risk were not significant (p > 0.05) for both PRIDE (T) and FINCA (T) implying that time risk is not a problem to the borrowing incurring joint liability.
According to Pavlou (2003) perceived risk drives an individual negatively in their adoption intention. These findings are in contrast to a major assumption in theoretical work that emphasize on aggregate welfare gains in microfinance, that potential borrowers are risk neutral and optimize over their expected income regardless of contractual risk associated with joint liability (Ghatak and Guinnane, 1999). The findings of this study suggest that the perceived risk associated with borrowing incurring joint liability matter to the microfinance institutions borrowers.
15. Global Journal of Management and Business Research
Volume XV Issue X Version I Year 2015 ( ) With respect to the perceived ease of use as a moderator of a perceived risk and borrowing incurring joint liability, the findings reveal that the path coefficients were significant (p ? 0.05) with ? = -0.64 for PRIDE (T) and ? = -0.66 for FINCA (T). The findings support the hypothesis that perceived risk moderated by perceived ease of use influence negatively borrowing as a group. These findings imply that high perceive risk associated with borrowing incurring joint liability, cause the potential users to perceive joint liability lending model as not easy to use, which influences negatively the decision to borrow incurring joint liability. These findings are in line with the theory of TAM (Davis et al., 1989). They found out that high perceived risk causes the potential users to devalue perceived ease of use, which affects negatively the adoption intention as in this case the joint liability lending model.
With respect to the perceived usefulness and borrowing incurring joint liability, the path coefficients for perceived usefulness were negative and significant (p ? 0.05), with ? = -0.31 for PRIDE (T) and ? = -0.80 for FINCA (T). These findings support the hypothesis that perceived risk of joint liability moderated by perceived usefulness influenced negatively the decision to borrow incurring joint liability. These findings imply that high perceived risk associated with borrowing incurring joint liability, caused borrowers to perceive the loans obtained incurring joint liability as not useful in helping them, to expand their business and meet other consumption needs.
With respect to the financial risk as a facet of perceived risk and its influence in borrowing incurring joint liability, the path were significant (p ? 0.05) and negative with ? = -0.46 from PRIDE (T) and ? = -0.35 from FINCA (T). These findings imply that risk of paying for the defaulters increase the financial risk associated with borrowing incurring joint liability.
With respect to psychological risk as a facet of perceived risk and its influence in borrowing incurring joint liability, the path were significant (p ? 0.05) and negative with ? = -0.24 for PRIDE (T) and ? = -0.64 for FINCA (T). Psychological risk in this study encompasses a mental stress to the joint borrowers because of partners" failure to repay the loans and a mental stress, caused by losing future access to credit in case group members fail to repay the defaulted loans of other group members. These findings suggest that the high risk of non-payers in joint liability, associated with not able to access future loans in case the group members failed to pay the defaulted loans, psychologically influences negatively borrowing incurring joint liability. With respect to performance risk as facet of perceived risk and its influence in borrowing incurring joint liability, the path coefficients were significant (p ? 0.05) with a ? = -0.48 for PRIDE (T) and ? = -0.45 for FINCA (T). According to Barboni et al. (2013), joint liability lending model has diminished its popularity because, some joint borrowers" free ride on their partners to bear their costs in case they fail to repay their loans. These findings imply that because of the high risk associated with borrowing incurring joint liability, especially the risk of partners" failure to repay the loans, borrowers perceive that joint liability lending model may not perform well in future.
With respect to privacy risk as facet of perceived risk and its influence in borrowing incurring joint liability, the path coefficients were found to be negative and significant (p ? 0.05) but weaker in magnitude with ? = -0.06 for PRIDE (T) and ? = -0.05 for FINCA (T). These findings indicate that privacy risk had a little influence on the decision to borrow incurring joint liability. The weak magnitude for privacy risk suggests that privacy risk to the joint liability borrowers was not a big issue. These findings are inconsistent with the study conducted by Harper (2007) who reveals that joint borrowers may suffer from reduced privacy. Thus, it is possible to say that different cultures perceive risk associated with borrowing incurring joint liability differently.
With respect to time risk as facet of perceived risk and its influence in borrowing incurring joint liability, the path coefficients were found to have insignificant influence on borrowing incurring joint liability (p > 0.05) for both PRIDE (T) and FINCA (T). These findings imply that joint borrowers perceive that time spent on attending group meetings, pressuring group members to repay the loans and finding a partner is not a problem. These findings are inconsistent with other studies which found that borrowers incur some disutility such as time spent on attending group meetings, repayment pressure and finding a partner (Montgomery, 1996;Zeitinger, 1996;Armendáriz and Morduch, 2000).
With respect to the overall risk and borrowing incurring joint liability, the path coefficients were negative, stronger in magnitude and significant (p ? 0.05) with ? = -0.71 for PRIDE (T) and ? = -0.80 for FINCA (T). These findings indicate that in overall, the perceived risk of joint liability influenced negatively borrowing incurring joint liability.
With regards to the perceived risk associated with joint liability and the decision to borrow incurring individual liability, the summaries of the results of testing hypothesis for PRIDE (T) and FINCA (T) are presented in Tables 9 and 10. The path coefficients for perceived risk were positive, stronger in magnitude and significant (p ? 0.05) with ? = 0.87 for PRIDE (T) and ? = 1.05 for FINCA (T). These findings support the hypothesis that perceived risk associated with joint liability influenced positively borrowing as an individual. Likewise, the results reveal significance path coefficients for perceived risk of joint liability and their measured variables (p ? 0.05) for both PRIDE (T) and FINCA (T), supporting the hypothesis that they influence positively borrowing incurring individual liability. However, the path coefficients between perceived risk and time risk were also not significant (p > 0.05) for both PRIDE (T) and FINCA (T).
Risk Perception and Adoption of Joint Versus Individual Liability: The Case of Selected Tribes in Tanzania Similarly, the path coefficients for the perceived ease of use and the decision to borrow incurring an individual liability were positive and significant (p ? 0.05) with ? = 0.34 for PRIDE (T) and ? = 0.21 for FINCA (T). These findings suggest that the high perceive risk associated with borrowing incurring joint liability, cause joint borrowers to prefer borrowing incurring an individual liability.
Likewise, the path coefficients for perceived usefulness and the decision to borrow incurring an individual liability were found to be positive and significant (p ? 0.05) with ? = 0.25 for PRIDE (T) and ? = 0.27 for FINCA (T). These findings suggest that borrowers perceive the loans obtained incurring an individual liability, as useful in helping them to expand their businesses and meet other consumption needs.
The findings also reveal that the path coefficients for financial risk and the decision to borrow incurring an individual liability were positive and significant (p ? 0.05) with ? = 0.35 for PRIDE (T) and ? = 0.22 for FINCA (T). These findings imply that the risk of paying for the defaulters drives joint borrowers to prefer borrowing incurring an individual liability.
In addition, the path coefficients for the psychological risk and the decision to borrow incurring an individual liability were positive and significant (p ? 0.05) with ? = 0.17 for PRIDE (T) and ? = 0.37 for FINCA (T). These findings suggest that the high risk of non-payers in joint liability, associated with not able to access future loans in case the group members failed to pay the defaulted loans, psychologically influences positively preference for an individual liability.
With respect to performance risk and the decision to borrow incurring an individual liability, the path coefficients were positive and significant (p ? 0.05) with ? = 0.39 for PRIDE (T) and ? = 0.37 for FINCA (T). These findings suggest that because of the high risk especially the risk of partners" failure to repay the loans With regards to privacy risk and the decision to borrow incurring an individual liability, the path coefficients were positive and significant (p ? 0.05) but weaker in magnitude with ? = 0.12 for PRIDE (T) and ? = 0.06 for FINCA (T). These findings imply that privacy risk had a little influence in borrowing decision between incurring joint vs. an individual liability.
With respect to overall risk and the decision to borrow incurring an individual liability, the path coefficients were positive and significant (p ? 0.05) with ? = 0.37 for PRIDE (T) and ? = 0.46 for FINCA (T). These findings imply that when all measures of perceived risk were evaluated together, the microfinance institutions borrowers perceive borrowing incurring joint liability as very risky and prefer borrowing incurring an individual liability.
16. V. Conclusion and Recommendations
Based on the findings of this study it is concluded that the high perceived risk associated with borrowing incurring joint liability, especially the risk of non-payers causes the joint liability borrowers to devalue perceived usefulness and the ease of use of the joint liability lending model. As a consequence, borrowers perceive borrowing incurring joint liability as not useful in helping them to expand their businesses. This paper bridges the gap between theory and empirical studies particularly, by integrating TAM and borrowing decisions incurring joint versus an individual liability. The findings of this study provides evidence, on the appropriateness of measuring the adoption of microfinance institutions lending model using TAM. The findings of this study suggest emphasis should be put on developing risk reduction strategies and improving the microfinance institutions lending models in order to encourage the majority of low income people to borrow from microfinance institutions, thereby improving the chances for the achievement of the goal of poverty alleviation.
17. VI.
18. Global Journal of Management and Business Research
![Figure 2.2 : Relationships between TAM variables, Perceived Risk Facets and Borrowing Incurring Joint Liability vs. Individual Liability b) Theoretical Framework This study use Technology Acceptance Model (TAM) variables by Davis (1989) i.e. perceived usefulness, and perceived ease of use integrated by perceived risk and its facets as a base theory. TAM has been applied in a more general context to a variety of (acceptance) decisions (Bartholomaus and Mayer, 2010). TAM as illustrated in Figure 2.1 includes the following concepts [Davis et al., 1989; Malhotra and Galletta, 1999]: ? External variables (EV): External variables (including issues like training, technology features, how the technology was developed, etc.) are typically thought to influence the use 5 of a technology (Featherman and Fuller, 2003). External variables influence perceived usefulness (PU) and perceived ease of use (PEU). ? Perceived usefulness (PU): Perceived usefulness is defined as the extent to which a person believes the innovation developed is useful and will enhance his or her job performance. ? Perceived ease of use (PEU): Perceived ease of use is the extent to which a person believes that the developed technology will be free of effort. ? Attitudes towards use (A): Attitude towards use is defined as the user"s desirability of using the technology developed.](https://journalofbusiness.org/index.php/GJMBR/article/download/1816/version/102426/6-Risk-Perception-and-Adoption_html/34989/image-2.png)
![.1 includes the following concepts [Davis et al., 1989; Malhotra and Galletta, 1999]: ? External variables (EV): External variables (including issues like training, technology features, how the technology was developed, etc.) are typically thought to influence the use 5 of a technology (Featherman and Fuller, 2003](https://journalofbusiness.org/index.php/GJMBR/article/download/1816/version/102426/6-Risk-Perception-and-Adoption_html/34990/image-3.png)
| Year | ||||||||||||
| 44 | ||||||||||||
| Volume XV Issue X Version I | PRIDE (T) | FINCA (T) | ||||||||||
| ( ) | Joint Liability | Individual Liability | JL+ IL | Joint Liability | Individual Liability | JL+ IL | ||||||
| Global Journal of Management and Business Research | Tribe Sex Age Highest Education | Chagga Zaramo Kinga Gogo Total Male Female Total 26-35 36-45 Greater than 45 years Total None Primary School | (JL) Freq. % Freq. % (IL) 25 27 68 73 0 0 46 100 46 Freq. Freq. % (JL) 93 8 17 0 0 25 29 60 71 85 15 29 1 2 55 98 56 0 0 51 229 280 23 4 8 44 92 48 3 20 47 20 185 80 232 20 11 51 229 280 23 6 11 51 89 57 4 9 30 20 120 80 150 14 12 15 21 58 79 73 5 12 51 229 23 3 13 20 87 23 3 15 48 20 192 80 240 20 11 | (IL) Freq. % 40 83 50 100 50 Freq. 48 36 71 51 51 100 51 177 200 12 80 15 165 89 185 177 200 42 91 46 99 88 113 36 88 41 177 200 17 85 20 158 89 178 | ||||||||
| Attained | O" Level | 0 | 0 | 17 | 100 17 | 0 | 0 | 2 | 100 2 | |||
| Total | 51 | 229 | 280 | 23 | 177 | 200 | ||||||
| Married | 44 | 18 207 | 82 | 251 | 18 | 10 | 159 | 90 | 177 | |||
| Marital | Divorced | 2 | 22 7 | 78 | 9 | 3 | 33 | 6 | 67 | 9 | ||
| Status | Widowed | 0 | 0 | 0 | 0 | 0 | 2 | 33 | 4 | 67 | 6 | |
| Cohabiting | 5 | 25 15 | 75 | 20 | 0 | 0 | 8 | 100 8 | ||||
| Total | 51 | 229 | 280 | 23 | 177 | 200 | ||||||
| Risk |
| PRIDE (T) | FINCA (T) | ||||
| Component | |||||
| S/NO. | Dimensions | 1 | 2 | 1 | 2 |
| 1 | Perceived Risk | -0.707 | 0.344 | -0.723 | 0.224 |
| 2 | Time Risk | -0.030 | 0.803 | -0.313 | 0.628 |
| 3 | Financial Risk | -0.896 | 0.135 | -0.939 | 0.076 |
| 4 | Performance Risk | 0.922 | 0.113 | -0.948 | 0.030 |
| 5 | Psychological Risk | -0.912 | 0.085 | -0.941 | 0.008 |
| 6 | Privacy Risk | 0.103 | 0.781 | -0.130 | 0.756 |
| 7 | Perceived Usefulness | 0.258 | 0.695 | 0.463 | -0.60 |
| 8 | Perceived Ease of Use | 0.857 | -0.080 | 0.912 | -0.025 |
| 9 | Overall Risk | -0.894 | 0.144 | -0.924 | 0.068 |
| Year | |||||||||
| ( ) | |||||||||
| Model | CMIN | RMR GFI | AGFI | NFI | RFI | IFI | TLI | CFI | RMSEA |
| Modifie | 13.335 | 0.049 | |||||||
| d Model | DF 8, P = | 0.049 0.990 0.941 | 0.995 0.976 | 0.998 0.990 | 0.998 | PCLOSE | |||
| 0.101 ? 2 /df | = 0. 460 | ||||||||
| = 1.667 | |||||||||
| Model | CMIN | RMR GFI | AGFI | NFI | RFI | IFI | TLI | CFI | RMSEA |
| Modifie | 8.460 | 0.017 | |||||||
| d Model | DF 8, P = | 0.059 0.991 0.948 | 0.995 0.979 | 1.000 0.999 | 1.000 | PCLOSE | |||
| 0.390 | = 0.704 | ||||||||
| ? 2 /df = 1.058 | |||||||||
| Model | CMIN | RMR GFI | AGFI | NFI | RFI | IFI | TLI | CFI | RMSEA |
| Modifie | 13.601 | 0.043 | |||||||
| d Model | DF 9, P = | 0.053 0.989 0.947 | 0.994 0.976 | 0.998 0.992 | 0.998 | PCLOSE | |||
| 0.137 | = 0.551 | ||||||||
| ? 2 /df = 1.511 | |||||||||
| Model | CMIN | RMR GFI | AGFI | NFI | RFI | IFI | TLI | CFI | RMSEA |
| Modifie | 9.864 | 0.034 | |||||||
| d Model | DF 8, P = | 0.057 0.989 0.939 | 0.994 0.974 | 0.999 0.995 | 0.999 | PCLOSE | |||
| 0.275 | = 0.596 | ||||||||
| ? 2 /df = 1.233 | |||||||||
| C |
| Standardized | Standard | Critical | P | |||
| Regression Weight | Error (S.E) | Ratio (C.R) | ||||
| Perceived Risk <---Perceived | -0.061 | 0.024 | 2.542 | 0.012 | ||
| Ease of Use | ||||||
| Perceived Risk <---Overall Risk | -0.256 | 0.025 | 10.240 | *** | ||
| Perceived Risk <---Financial Risk -0.162 | 0.026 | 6.231 | *** | |||
| Perceived Risk <---Psychological | -0.292 | 0.024 | 12.167 | *** | ||
| Risk | ||||||
| Perceived Risk <---Performance | -1.739 | 0.032 | 54.344 | *** | ||
| Risk | ||||||
| Perceived Risk <---Time Risk | -0.086 | 0.045 | 1.911 | 0.074 | ||
| Perceived Risk <---Privacy Risk | -0.086 | 0.027 | 3.185 | 0.002 | ||
| Perceived | Usefulness | <--- | -0.151 | 0.035 | 4.314 | *** |
| Perceived Ease of Use of Joint | ||||||
| liability | ||||||
| Perceived | Usefulness | <--- | -0.184 | 0.066 | 2.788 | 0.005 |
| Perceived Risk | ||||||
| Standardized Indirect Effect with Joint Liability: | ||||||
| Perceived Risk = -0.71*** | ||||||
| Year | |||||
| 50 | |||||
| Volume XV Issue X Version I | Perceived Risk <---Perceived Ease of Use Perceived Risk <---Overall Risk Perceived Risk <---Financial Risk Perceived Risk <---Psychological | Standardized Regression Weight 0.148 0.206 0.178 0.224 | Standard Error (S.E) 0.036 0.044 0.045 0.059 | Critical Ratio (C.R) -4.111 -4.682 -3.956 -3.797 | P *** *** *** *** |
| ( ) | Risk Perceived Risk <---Performance | 0.166 | 0.053 | -3.132 | *** |
| Global Journal of Management and Business Research | Risk Perceived Risk <---Time Risk Perceived Risk <---Privacy Risk 0.208 0.034 Perceived Usefulness <---Perceived Ease of Use 0.214 Perceived Usefulness <---Perceived Risk 0.401 Standardized Indirect Effect with Individual Liability: Perceived Risk = 0.87*** Perceived usefulness = 0.25*** Perceived Ease of Use = 0.34*** Financial Risk = 0.35*** Overall Risk = 0.37*** Psychological Risk = 0.17** Privacy Risk = 0.12*** Time Risk = 0.06 | 0.045 0.028 0.045 0.105 | 0.756 7.429 -4.756 -3.820 | 0.453 *** 0.012 *** | |
| Performance Risk = 0.39*** | |||||
| R 2 = 0.71 | |||||
| F Value = 172.459*** | |||||
| Note: ** p<0.05, ***p=0.000 | |||||
| Standardized | Standard | Critical | P | |||
| Regression Weight | Error (S.E) | Ratio (C.R) | ||||
| Perceived Risk <---Perceived | 0.071 | 0.024 | -2.958 | 0.03 | ||
| Ease of Use | ||||||
| Perceived Risk <---Overall Risk | 0.236 | 0.025 | -9.437 | *** | ||
| Perceived Risk <---Financial | 0.074 | 0.027 | -2.741 | 0.007 | ||
| Risk | ||||||
| Perceived Risk <---Psychological | 0.198 | 0.024 | -8.252 | *** | ||
| Risk | ||||||
| Perceived Risk <---Performance | 0.153 | 0.042 | -3.643 | *** | ||
| Risk | ||||||
| Perceived Risk <---Time Risk | 0.044 | 0.028 | 1.571 | 0.142 | ||
| Perceived Risk <---Privacy Risk 0.074 | 0.013 | 5.692 | *** | |||
| Perceived | Usefulness | <--- | 0.151 | 0.035 | -4.314 | *** |
| Perceived Ease of Use | ||||||
| Perceived | Usefulness | <--- | 0.184 | 0.076 | -2.421 | 0.016 |
| Perceived Risk | ||||||
| Standardized Indirect Effect with Individual Liability: | ||||||
| Perceived Risk = 1.05*** | ||||||
| Perceived usefulness = 0.27** | ||||||
| Perceived Ease of Use = 0.21*** | ||||||
| Financial Risk = 0.22** | ||||||
| Overall Risk = 0.46*** | ||||||
| Psychological Risk = 0.37** | ||||||
| Privacy Risk = 0.06** | ||||||
| Time Risk = 0.08 | ||||||
| Performance Risk = 0.37*** | ||||||
| R 2 = 0.70 | ||||||
| F Value = 179.228*** | ||||||
| Note: ** p<0.05, ***p=0.000 | ||||||