1. Introduction
tock markets have long played an important role in economic life (Stijn, V. N., Frans, B., Ludo, C., 2006). This paper examines the long run and causal relationship between stock market development and economic growth. In general, the literature indicates that long-run growth is positively associated with the development of stock markets (e.g. Zervos, 1996, 1998;Singh, 1997), and that the liquidity of stock markets is strongly correlated with current and future rates of economic growth .
The objective of this study is to explore the presence of a causal relationship between stock market development and economic growth in Sri Lanka. Nominal GDP values are used as a proxy for economic growth, and market capitalization ratio (MCR) is used as a proxy for stock market development. Second indicator used is the value traded ratio, which equals the total value of shares traded on the stock exchange divided by GDP (VT) (Akinlo, A.E., & Akinlo, O.O., 2009). To address this relationship, a Granger Causality Test was employed. However, before running a Granger Causality test, it must be determined whether the variables are stationary and, if not, whether they are co-integrated. To test whether variables are stationary, an augmented Dickey-Fuller unit root test (ADF) was employed.
2. II.
3. Literature Review
The idea that financial development promotes growth was first put forth by Schumpeter as early as 1911 (Schumpeter, 1912). Several other economists have investigated this relationship and hold the view that financial development is a necessary condition for achieving high rate of economic growth (Goldsmith, 1969;.
The relationship between financial development and economic growth has been debated quite extensively in the literature, yet the direction of causality relationship remains unresolved. The debate has focused on whether financial development causes economic growth or economic growth causes financial development or whether a two-way relationship exists. While some studies found a unidirectional causality running from financial development to economic growth; others reported the obverse. Few other studies found evidence of bidirectional relationship while a handful provided evidence of neutrality of finance and economic growth. However, the general observation from the literature is that most studies on the causal relationship between financial development and economic growth have focused on developed economies. Although few studies, based exclusively on African data, exist on the finance-economic growth puzzle, none has considered the relationship between in Africa, the emphasis has been on testing for market efficiency, development of the stock markets and the impact of economic variables on stock markets (Akinlo, A.E., & Akinlo, O.O., 2009).
Several empirical studies have been conducted on the impact of financial development on economic growth. However, some of these have focused specifically on stock markets. These include Zervos (1993, 1998), Atje and Jovanovic (1993), Rousseau and Wachtel (2000), Beck and Levine (2002) and Caporale, Howells, and Soliman (2004) among others. The study by Atje and Jovanovic (1993) using cross-sectional regressions concludes that stock markets have long-run impacts on economic growth. Harris (1997) equally shows, within a cross-sectional framework, that stock markets promote growth though this occurs for developed countries. Levine and Zervos (1998) study of 48 countries concludes that stock market liquidity positively predicts growth, capital accumulation and productivity improvements. In addition, they show that stock market size, volatility and international integration are not robustly linked with growth. Rousseau and Wachtel (2000) and Beck and Levine (2002) using cross country regression framework show that stock market development is strongly correlated with growth rates of real GDP per capita.
More importantly, they find that stock market liquidity and banking development both predict the future growth rate of the economy when the two variables both enter the growth regression. Studies by Arestis, Demetriades, and Luintel (2001) using time series data on five industrialized countries indicate that stock markets play a role in growth whilst Caporale et al. ( 2004) using techniques developed by Toda and Yamamoto (1995) show that well-developed stock markets can foster economic growth in the long run.
Stock markets can influence economic growth in the developing economies in several ways. By enabling savers to acquire equity which they can sell when they wish to have access to their savings or change their portfolios, liquid stock markets enable investors to reduce risk (Levine, 1996). Stock markets also play an important role in allocating capital to the corporate sector through the sale of shares. Particularly in countries faced with financial constraints, stock markets enable firms to raise capital required for longterm investment which in turn promotes economic growth. Liquid stock markets can in addition, promote economic growth by reducing transactions costs (Bencivenga et al., 1996). By permitting investors to hold shares in a number of firms, stock markets enable risk diversification. Risk diversification allows more profitable investments to be undertaken contributing to economic growth.
The somre of literature focuses on (long-term) stock market development. Levine and Zervos (1998b) outline a benevolent mechanism from liberalization through overall stock market development to the real economy. Briefly, they find that liberalization tends to increase various measures of stock market development, including market capitalization to GDP and liquidity (measured by the total valued traded to GDP or alternatively, to total market capitalization). Citing a separate inquiry (Levine and Zervos, 1998a), equity market development, in particular market liquidity, is in turn, a robust determinant of macroeconomic growth using a sample of up to approximately 65 higherand lower-income countries from 1976 to 1993. Therefore, this benevolent long-run indirect mechanism from reform to growth.
Especially, samples that produce positive empirical relations between stock market development indicators and economic growth include developed countries. Even augmented analyses that include cases in which stock market activity is 'inconsequential' (Levine and Zervos, 1998a, p. 553) still use information from OECD countries to produce robust estimates. Gurley and Shaw (1955), who argued that financial sector development promotes economic growth by enhancing physical capital accumulation. Following this evidence, studies by and showed that financial sector development is key to economic growth subject to dismantling financial repression. These two studies did not explicitly outline the role of stock markets; -in fact Shaw argued that the development of stock markets in early stages of development may be very expensive for developing economies. Stock markets impact on the economy in the following ways: (i) it helps in savings mobilization and therefore increasing the savings rate thus facilitating higher capital formation and economic growth, (ii) it reduces investment risks owing to the ease with which equities are traded. This therefore implies that the stock markets play a central role in economic performance.
4. III.
5. Methodology a) Econometric model
A Vector Auto-Regression (VAR) model was used to analysis the dynamic impact of random disturbances on the system of variables. The VAR model includes the following 03 variables.
? Nominal GDP (GDP) ? Stock market capitalization ratio (MCR) ? Stock value traded ratio (VT) b) Data CollectionSample period uses annual time series data over the period from 1990 to 2013. These annual data were obtained from the various issues of Economic and Social Statistics of Sri Lanka and Annual reports published by the Central Bank of Sri Lanka. Nominal GDP values are used as a proxy for economic growth, and market capitalization ratio (MCR) is used as a proxy for stock market development.
Stock market capitalization ratio (LS) -This variable is the ratio of the total value of listed shares (market capitalization) to GDP, both in nominal values. This variable aims to measure the development of stock markets under the assumption that the "size" of the market is positively correlated with existing liquidity (Levine and Zervos, 1996).
Second indicator used is the value traded ratio, which equals the total value of shares traded on the stock exchange divided by GDP (VT) (Akinlo,A.E., & Akinlo, O.O., 2009).
Table o1 shows the summary statistics of nominal GDP values, stock market capitalization ratio and stock value traded ratio.
6. Results and Discussion
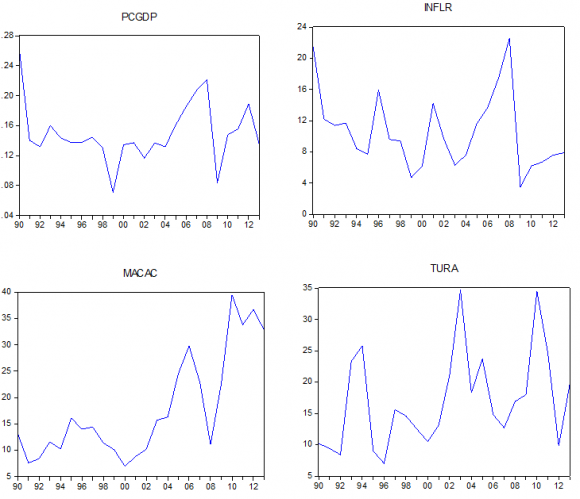
Fig. 1 indicates the non stationary of the variables. If there is no stationary, there is a possibility that spurious regressions will be produced (Harris, 1995).
7. F igure 01
In principle researchers should consider that the relationships among variables have a long-run equilibrium. As a consequence, the co integration of those variables is tested. To do so, assure that all variables are integrated in order one, I (1). To analyze the order of integration of variables, worked upon: (i) graphical analyses of the level variables (Fig. 1) and (ii) Augmented Dick Fuller (ADF) test.
The Dickey-Fuller (ADF) test was applied to test each variable for stationary (including constant without trend and constant with trend) (table 02). The result indicate that the null hypothesis proposing nonstationarity of unit roots in the time series could not be rejected in both constant with trend and constant without trend for all variables (table 02). The test was, therefore, applied again at first difference for all variables those were found to be non-stationary at level. Therefore, the results indicate that the null hypothesis (proposing non stationary of unit roots in the time series) should be rejected at first difference (table 02). This
8. a) VAR test
Having established stationarity for the variables at first difference, it was then possible to conduct the test of co-integration for long-term equilibrium by applying the VAR model (table 03).
The overall results for goodness of fit (calculated by R2 and adjusted R2) indicate that the estimated regressions were mostly explained by the independent variables on the right side of the equations. In addition, the F-test indicated that the null hypothesis (proposing no co integration among variables) should be rejected at the 5% significance level which means that long-term relationship exist among all the variables. The Johansen co-integration test results indicate that the null hypothesis (proposing no cointegrated) should be rejected at the 5% significance level. This supports the findings of the existence of a long-term relationship between economic growth and stock market performance (table 04). Granger (1969), occurs when a particular variable in the present or in the past helps predict future values of another variable. The forecast error variance decomposition allows us to assess how a variable responds to shocks in specific variables, while the impulse response function allows us to analyze the behavior of the variables according to an existing impulse in another variable (ceteris paribus). In other words, it demonstrates the effect that a shock in the error term, in a given period, has on the values of current and future endogenous variables.
The null hypothesis for these tests can be formulated as follows,
? MCR does not Granger Cause GDP and vice versa ? VT does not Granger Cause GDP and vice versa Table 05 shows that the first null hypothesis (proposing that MCR do not Granger -cause GDP) should be rejected at the 1% significance level, the converse of the null hypothesis (proposing that GDP do not Granger-cause MCR) should be rejected at the 1% significance level. The results also show that the second null hypothesis (proposing that VT do not Grangercause GDP) should not rejected and the converse of the null hypothesis is (proposing that GDP does not Grange Cause VT) could also be rejected. The results also show that the third null hypothesis (proposing that VT do not Granger -Cause MCR) be not rejected; however the converse of the null hypothesis (proposing that MCR does not Granger-Cause VT) could be rejected at the 5% significance level.
The overall results from table 05 provided evidence that the MCR have a strong relationship with economic growth in Sri Lanka.
V.
9. Conclusion
The present study investigated the relationship between economic growth and stock market performance in Sri Lanka. By applying the modern econometric techniques, the study was able to identify important aspects of the long-term relationship between these variables from 1990-2013. The results also indicate co-integration between economic growth and stock market performance. In summary, the results of this study support the preposition that the stock market performance plays a major role in economic growth in Sri Lanka.
10. Global
11. Null Hypothesis
Obs. F-Statistic Prob.

| Variable | Definition | Descriptive Statistics | ||||
| observations | Mean | SD 1 | Min 2 | Max 3 | ||
| GDP | Nominal GDP values | 24 | 2.5594E6 | 2.45691E6 | 3.22E5 | 8.67E6 |
| MCR | Stock market capitalization ratio | 24 | 17.6375 | 8.25289 | 7.00 | 34.5 |
| VT | Stock value traded ratio | 24 | 0.030892 | 0.0236244 | 0.0049 | 0.1018 |
| Notes: | ||||||
| 1 Standard deviation | ||||||
| 2 Minimum | ||||||
| 3 Maximum | ||||||
| c) Data Analysis | ||||||
| The following method were used for data | ||||||
| analysis and evaluation | ||||||
| ? | ||||||
| Variables | Level | Constant without trend | Constant with trend |
| GDP(Log) | 0.532543 | -1.050515 | |
| MCR | 0.150777 | -2.290059 | |
| VT | -0.156366 | -3.201228 * | |
| First Difference | |||
| GDP(Log) | -3.320839 ** | -3.327760 ** | |
| MCR | -4.233221 *** | -4.213487 ** | |
| VT | -4.840989*** | -4.717159 *** | |
| ***, ** and * imply that the reject the null hypothesis is that the time series has a stochastic | |||
| trend or contain a unit root at 1%, 5% and 10%, respectively. | |||
| MCR | VT | LNGDP | |
| MCR(-1) | 0.706221 | 0.002006 | 0.004506 |
| (0.27027) | (0.00103) | (0.00130) | |
| [ 2.61301] | [ 1.94000] | [ 3.47568] | |
| MCR(-2) | -0.938607 | -0.001544 | 9.50E-05 |
| (0.40029) | (0.00153) | (0.00192) | |
| [-2.34484] | [-1.00793] | [ 0.04945] | |
| VT(-1) | -4.703960 | 0.228779 | -0.362138 |
| (63.4827) | (0.24288) | (0.30451) | |
| [-0.07410] | [ 0.94196] | [-1.18925] | |
| VT(-2) | 146.6656 | -0.316842 | -0.255786 |
| (75.3135) | (0.28814) | (0.36126) | |
| [ 1.94740] | [-1.09961] | [-0.70804] | |
| LNGDP(-1) | 71.05999 | -0.055365 | 1.116798 |
| (57.7033) | (0.22077) | (0.27679) | |
| [ 1.23147] | [-0.25079] | [ 4.03487] | |
| LNGDP(-2) | -65.96647 | 0.065647 | -0.130336 |
| (57.1462) | (0.21863) | (0.27411) | |
| [-1.15435] | [ 0.30026] | [-0.47548] | |
| C | -65.14037 | -0.111445 | 0.258234 |
| (25.0276) | (0.09575) | (0.12005) | |
| [-2.60274] | [-1.16389] | [ 2.15105] | |
| R-squared | 0.761273 | 0.563790 | 0.999551 |
| Adj. R-squared | 0.665782 | 0.389306 | 0.999372 |
| F-statistic | 7.972201 | 3.231181 | 5567.747 |
| Hypothesized No. of CE(s) | Eigenvalue | Trace Statistic | 0.05 Critical Value | Prob.** |
| None * | 0.640806 | 34.15429 | 24.27596 | 0.0021 |
| At most 1 | 0.326104 | 11.62866 | 12.32090 | 0.0651 |
| At most 2 | 0.125319 | 2.945707 | 4.129906 | 0.1019 |
| Trace test indicates 1 co-integrating equations at the 0.05 level | ||||
| * denotes rejection of the null hypothesis at the 0.05 level | ||||
| **MacKinnon-Haug-Michelis (1999) p-values | ||||
| b) Granger causality test | ||||
| Granger causality allows us to identify the | ||||
| causal relationship between the series, which, according | ||||
| to | ||||
| MCR does not Granger Cause GDP | 22 | 13.4675 | 0.0003 |
| GDP does not Granger Cause MCR | 7.08759 | 0.0058 | |
| VT does not Granger Cause GDP | 22 | 0.82200 | 0.4563 |
| GDP does not Granger Cause VT | 9.39923 | 0.0018 | |
| VT does not Granger Cause MCR | 22 | 1.01028 | 0.3850 |
| MCR does not Granger Cause VT | 3.71301 | 0.0459 |