1. Introduction of the Study
nvestment in the stocks becomes a popular choice for the investors in the recent decade. The investor wants to minimize the risk of losing the money. "To minimize this risk investor wants to invest his money in the different stock exchanges. In these days everyone wants to invest their money in shares. So the exchanges become important, which provides services for stockbroker and traders to trade, stocks, bonds, and other securities. Apart from this the stock exchanges offer a number of different facilities which includes reclamation of securities and financial instruments. "Securities traded on a stock exchange include shares issued by companies, unit trusts, derivatives, pooled investment products and bonds". A stock exchange is basically a market where you buy and sell stocks. The stock exchange works by companies buying and selling stock in their companies.
The investors want to diversify the investments so that if he faces the loss from one side, he may recover it from the other side. In the case of stock exchanges, the investor wants to invest in the global stock exchange where there is no correlation among the stock exchanges. The reason is this that if there will be a co-integration between the stock exchanges the result of increase and decline will impact all the exchanges. Elyasiani et al. (1998) supported the statement in his research and stated that the investor continuously look to invest in the markets which has no relation with each other. The same findings has been generated by Wong et al (2004), Hoque (2007), Menon, Subha, Sagaran (2009) in their studies.
This study investigates the inter-linkage among the stock exchanges of USA and Islamic Countries (Indonesia, Malaysia, Israel and Pakistan). The study had chosen the Jakarta Stock Exchange (JSX) from Indonesia, TASE from Israel, Kuala Lumpur Stock Exchange from Malaysia, Karachi Stock Exchange (KSE) from Pakistan and NYSE from USA for the purpose of the study.
2. II.
3. Review of Literature
A number of researchers studied the topic of inter-linkage among the stock exchanges. The studies of Chan et al. (1992), Chaudhuri (1997), Masih. Et.al (1997), Elyasiani et al. (1998), Pan et al. (1999), Verchenko (2000), Bala and Mukand (2001), Sharma and Wongbangpo (2002), Worthington et al. (2003), Yang et al. (2003), Hoque (2007), Menon Et. al (2009), MacDonald (2001), Serwa and Bohl (2003), Wong et al (2004), Narayan et al (2004), Chuang et al (2007) Scholars have done the studies in the different parts of the globe. Masih. Et.al (1997) investigates the linkage between the NSE and the stick exchanges of Taiwan, South Korea, Singapore and Hong Kong. The researchers took the closing data of these stock exchanges from January 1982 to June 1994 as the sample for the study. Elyasiani et al. (1998) study the linkage between the US market and the Asian markets includes Sri Lankan Stock Market. Verchenko (2000) & Bala and Mukand (2001) evaluates the inter-linkage between the USA and the Indian stock markets. Noor. Et.al (2006) investigates the day-of-the-week effect, month-of-the year effect and holiday effects in Australia, China, Hong Kong, Japan, India, Indonesia, Malaysia, Singapore, South Korea and Taiwan stock markets. Hoque (2007) study the impact of Indian and US markets on the stock exchange of Dhaka. Menon. Et.al (2009) study the relationship amongst the Indian, US and Hong-Kong market. Wong et al (2004) studies the long and short term relationship amongst the Indian and worlds developed countries stock exchanges. Kwan.
4. I
Researchers used various tools to analyzed the data Wong et al (2004) used the Granger causality for the analysis. Bala and Mukand (2001), Wong et al (2004), Hoque (2007), Menon. Et.al (2009)) apply co integration model for the evaluation of the data.
The researchers revealed a number of facts in their respective research. Masih. Et.al (1997) revealed that there is not significant impacts of thee stock markets on each other and they operates freely. Elyasiani et al. (1998) uncovers that there if no relationship found between the US and Sri Lankan markets with the major Asian Markets. Verchenko (2000) Bala and Mukand (2001) finds that there is opportunities for the investors to diversify their funds in Indian and US markets as there was no co-integration found in these two markets. Noor. Et. al (2006) reveals that the existence of seasonality in stock markets and also suggested that this is a global phenomenon. Hoque (2007) argues in his study that the Indian and the US markets does not impacts the Dhaka Stock Exchange. Menon. Et.al (2009) depicts that there is no relationship amongst the Indian and the US markets. The study also reveals that the result is same in the case of Indian and Hong Kong stock market also. Wong et al (2004) finds that after the globalization the stock markets of the globe effect each other upto a certain extent. Kwan. Et.al (1995) reveals that there is a perceptible relation between the returns of Australian market and the markets of Hong Kong, Japan, Korea, Taiwan, the U.K. and the US. MacDonald (2001) finds in his research that there is a co-integration in the long term returns of US, Germany & UK. Serwa and Bohl (2003) reveals the fact that the emerging markets does not impacts the emerged markets.
The above studies that have been undertaken, a majority has studied the linkages with the stock markets in the developed world. Moreover, there is hardly any research that has studied the stock market linkages between the US and Islamic nations. The present study will attempts to find out the relationship amongst the US and the Islamic market which is a study highly called for.
5. III. Objectives of the Study
? To evaluate the inter-linkage between the USA and Islamic Countries Stock Market.
? To study the interdependency of the stock exchanges on each other.
IV.
6. Research Methodology
The current study evaluates the relationship amongst stock markets of the NYSE and Indonesia, Malaysia, Israel, and Pakistan. The study selected the one major stock market from ech country and take their indices as the closing data. Study selected the Jakarta stock exchange (JCI), TEL-Aviv stock exchange Israel (TA-100), Kuala Lumpur stock exchange (KLSE), New York stock exchange (NYSE composite) and Karachi stock exchange (KSE-100).The indices are used for stock exchanges are JCI, TA-100, FBMT 100, NYSE composite and KSE-100. All Share Index has been used for the study purpose. The daily closing levels of the five representative indices for a period beginning on 1 st April 2005 through 31 st March 2015 has been considered as the reference period. In this way, data of total 60 months are taken for the purpose of the study.
For the evaluation of the data econometrics tools has been applied. For the basic understanding of Unit root testing, we may look at the following equation
y t = ?y t-1 + x t ?? + ? t ,(1.1)where x t are optional exogenous repressors which may consist of constant, or a constant and trend, ? and ? are parameters to be estimated, and the ? t are assumed to be white noise. If |?| ? 1, y is a non-stationary series and the variance of y increases with time and approaches infinity. If |?|<1, y is a (trend-) stationary series. Thus, we evaluate the hypothesis of (trend-) stationary by testing whether the absolute value of |?| is strictly less than one. The Standard Dickey-Fuller test is carried out by estimating equation (1.2) after subtracting y t-1 from both sides of the equation.
?y t = ? y t-1 + x t ?? + ? t,(1.2)Where ? = ? -1. The null and alternative hypotheses may be written as,
H 0 :? = 0 H1 :?< 0 (1.3)In order to make the series stationary, we take the log of the five series and arrive at the daily return of the two series.
The Granger (1969) approach to the question of whether x causes y is to see how much of the current y can be explained by past values of y and then to see whether adding lagged values of x can improve the explanation. y is said to be Granger-caused by x if x helps in the prediction of y, or equivalently if the coefficients on the lagged x 's are statistically significant.
? To suggest the investors the best stock exchanges for investment.
y t = ? 0 + ? 1 y t-1 + ?? + ? l y t-l + ? 1 x t-1 + ?? + ? l x t-l + ? t x t = ? 0 + ? 1 x t-1 + ?? + ? l x t-l + ? 1 y t-1 + ?? + ? l y t-l + µ tThe reported F-statistics are the Wald statistics for the joint hypothesis:
? 1 =? 2 = ???= ? t = 0 (1.5)for each equation. The null hypothesis is that x does not Granger-cause y in the first regression and that y does not Granger-cause x in the second regression.
V.
7. Findings & Analysis
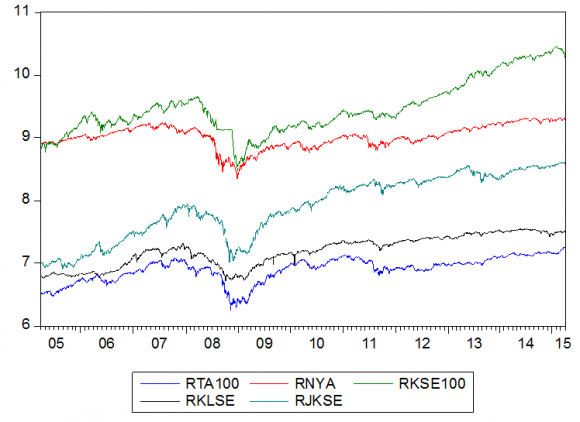
This chapter reveals the result of the analysis of the data. There is a difference in the real time data of the exchanges and a huge deviation observed in the data, thus the return has been calculated for all the indices. Fig. 1 shows the graph of the return for all the indices. The graph shows comparatively a high stationarity. The return for the indices named as RNYA for New York Stock Exchange, RTA 100 for Israel Stock Exchange, RKSE for Karachi Stock Exchange, RKLSE for Kualalampur Stock Exchange and RJKSE for Jakarta Stock Exchange.
Further table 1 reveals the results of the descriptive statistics. The KSE shows the highest mean in return which 9.04 followed by the NYS 9.01 is. The deviation shows that the data is stationary in the nature as the deviation is less than 1 in all the cases. The result of the Jarque-bera probability shows the normalcy of the data. Table 2 reveals the results of the correlation analysis up-to the lag of 36. The results indicate that there is not much effect of the previous day trading on the current day trading as the results of the correlation shows that the correlation is negligible right from lag of 2 and it continues up-to the lag of 36.
Though the results of the Group Unit root shows that the data has a unit root as the null hypothesis is accept in the test. The probability value is more than 0.05 in all the cases. Table 5 reveals the result of the vector auto regression test and it also reveal the fact that NYA regress the KSE and KLSE at the lag of 1, RTA regress KSE at lag of 2, KSE regress NYA at lag of 1, KLSE regress KSE at lag of 1. The result also shows that NYS does not regress himself from a great extent whether all the other have a high regression in case of constant.
8. Conclusion
The study reveals that there is a notable impact of the New York Stock Exchange on the other Muslim stock exchanges but there is no reverse impact of these stock exchanges on the NYA. The research also unearths that Karachi stock exchange does not impact any of the stock exchanges but get influenced from New York Stock Exchange and Kualalmpur Stock Exchange. The case os same in the case of Jakarta Stock Exchange also where the JKSE get influenced by KLSE but does not influence any of the stock exchange. The study further shows that there is no impact of the last day on the present day trading on any of the stock exchange which is a good sign for the investors. The results of the regression also shows the same results that NYA regress most of the stock exchanges on the lag of 1. Regression results further reveals that apart from NYA most of the stock exchange regress them self.
To conclude the study may suggest that these countries are good option for the investors as there is no huge relationship observed between these stock exchanges.
9. Global Journal of Management and Business Research
Volume XV Issue VIII Version I Year 2015 ( ) C

| RTA100 | RNYA | RKSE100 | RKLSE | RJKSE | |
| Mean | 6.901240 | 9.018974 | 9.475220 | 7.195857 | 7.897663 |
| Median | 6.937829 | 9.021328 | 9.385318 | 7.225714 | 7.928352 |
| Maximum | 7.259595 | 9.316690 | 10.45813 | 7.545733 | 8.615893 |
| Minimum | 6.249454 | 8.349085 | 8.479562 | 6.720715 | 6.902512 |
| Std. Dev. | 0.196122 | 0.182418 | 0.427684 | 0.243967 | 0.501428 |
| Skewness | -0.884215 | -0.662272 | 0.606847 | -0.362975 | -0.393119 |
| Kurtosis | 3.313461 | 3.463789 | 2.736547 | 1.867210 | 1.863964 |
| Jarque-Bera | 328.8768 | 200.8085 | 157.2667 | 184.5667 | 194.6127 |
| Probability | 0.000000 | 0.000000 | 0.000000 | 0.000000 | 0.000000 |
| Cross- |
| Null Hypothesis: | Obs | F-Statistic | Prob. |
| RNYA does not Granger Cause RTA100 | 2444 | 3.64984 | 0.0121 |
| RTA100 does not Granger Cause RNYA | 1.25555 | 0.2880 | |
| RKSE100 does not Granger Cause RTA100 | 2444 | 2.25551 | 0.0800 |
| RTA100 does not Granger Cause RKSE100 | 1.54502 | 0.2008 | |
| RKLSE does not Granger Cause RTA100 | 2444 | 5.32913 | 0.0012 |
| RTA100 does not Granger Cause RKLSE | 0.73474 | 0.5312 | |
| RJKSE does not Granger Cause RTA100 | 2444 | 0.80384 | 0.4916 |
| RTA100 does not Granger Cause RJKSE | 3.66465 | 0.0119 | |
| RKSE100 does not Granger Cause RNYA | 2444 | 1.10498 | 0.3458 |
| RNYA does not Granger Cause RKSE100 | 3.76466 | 0.0104 | |
| RKLSE does not Granger Cause RNYA | 2444 | 0.76338 | 0.5145 |
| RNYA does not Granger Cause RKLSE | 3.11541 | 0.0252 | |
| RJKSE does not Granger Cause RNYA | 2444 | 0.33234 | 0.8020 |
| RNYA does not Granger Cause RJKSE | 2.01918 | 0.1091 | |
| RKLSE does not Granger Cause RKSE100 | 2444 | 2.69859 | 0.0443 |
| RKSE100 does not Granger Cause RKLSE | 0.08070 | 0.9705 | |
| RJKSE does not Granger Cause RKSE100 | 2444 | 0.82828 | 0.4782 |
| RKSE100 does not Granger Cause RJKSE | 0.14503 | 0.9329 | |
| RJKSE does not Granger Cause RKLSE | 2444 | 0.06940 | 0.9763 |
| RKLSE does not Granger Cause RJKSE | 12.2537 | 6.E-08 |
| RTA100 | RNYA | RKSE100 | RKLSE | RJKSE | |
| RTA100(-1) | 0.999605 | 0.014694 | -0.033653 | 0.010188 | -0.003247 |
| (0.02026) | (0.02301) | (0.02150) | (0.01595) | (0.02386) | |
| [ 49.3429] | [ 0.63867] | [-1.56528] | [ 0.63858] | [-0.13611] | |
| RTA100(-2) | -0.015211 | -0.014361 | 0.025538 | -0.015688 | 0.010393 |
| (0.02019) | (0.02293) | (0.02143) | (0.01590) | (0.02378) | |
| [-0.75326] | [-0.62619] | [ 1.19162] | [-0.98645] | [ 0.43705] | |
| RNYA(-1) | 0.007656 | 0.908917 | 0.006421 | 0.015451 | -0.027733 |
| (0.01782) | (0.02024) | (0.01891) | (0.01404) | (0.02099) | |
| [ 0.42961] | [ 44.9054] | [ 0.33950] | [ 1.10084] | [-1.32141] | |
| RNYA(-2) | -0.000384 | 0.081454 | 0.009553 | -0.004270 | 0.016586 |
| (0.01795) | (0.02038) | (0.01905) | (0.01414) | (0.02114) | |
| [-0.02141] | [ 3.99585] | [ 0.50149] | [-0.30208] | [ 0.78471] |