1. Introduction
nnovate or evaporate is the success mantra followed by banking sector to exist in the competitive market by focusing on inventions and improvements in electronic delivery channels. The use of technology in expanding banking has been a key focus area of the Reserve Bank. Technological innovation not only enables a broader reach for consumer banking and financial services, but also enhances its capacity for continued and inclusive growth. There are several factors attributed to India's high growth in the recent period-improved productivity, growing entrepreneurial spirit, and higher savings, to name the most important. But one factor usually goes unacknowledged -that is financial intermediation. Improvement in the quantum and quality of financial intermediation ranks along with other factors mentioned above as a key growth driver. And one of the factors that drove the improvement in the quantum and quality of financial intermediation is more wide spread and more efficient use of IT in banking sector. Shastri, (2000), studied the emergence of IT in banking sector. He highlighted some challenges faced by banks regarding IT implementation. Rao (2002) analyzed the impact of new technology on banking sector. The technology is changing the way the business is done and opened new vistas for doing the same work differently in most cost effective manner. Tele-banking and internet banking are making forays such that branch banking may give to home banking. He provided some policies to protect their profitability.
Electronification is a relatively new concept in consumer transactions and these are mostly cash and paper-based. In this segment, less than 3% of the consumer-to-business flow value is electronic. With over US$133 billion payments from bank accounts via ECS and NEFT, electronic fund transfers have emerged as the much-preferred option for transactions, with an increasing orientation toward cashless and even cheque-less payments in India. Presently almost 98 per cent of the branches of public sector banks are fully computerized in India, and within which almost 90 per cent of the branches are on core (Centralized online real time exchange) banking platform. Joint ventures have been set up between telecommunication companies and banking sector that envisages opening bank accounts, cashless transfers, cashless spending and payment facilities, targeting the rural and urban poor etc. The regulators believes that mobile banking is yet to show remarkable growth even after the daily transaction limits have been raised to Rs. 50,000 per day per customer. Apart from major banks such as SBI and ICICI & other banks are still to gain numbers in terms of volume and value of transactions. With an objective to deliver higher value for the savings account customers, banks have designed savings accounts with an auto sweep facility with the help of technology. Some banks have established virtual or self-banking branches where the customer enters the branch, explores services on the touch screen and at any time calls up members of the bank staff by video conferencing.
Traditional banking has always been a brick and mortar building where people go to deposit or withdraw money. However, the banking Internet sector has exploded in the past ten years in India. ICICI was the first bank in India to introduce e-banking services in India. Online banking can be a bit confusing because it has so many names from internet banking to personal computer (PC) banking as well as electronic banking and banking online. Shetty, (2000), technology is dramatically altering the ways in which financial services are delivered to consumers and continue to do so in future too. Electronic banking or the use of computers and electronic technology as a substitute for traditional paper based transactions, is here to stay.
With the popularity of the Internet and the power it gives people to take control of their lives, many traditional banks have created banking Internet web pages where customers could transfer money, set up bill payments recurring or otherwise, quickly check items that have cleared, and many other functions that can be accessed 24 hours per day 7 days a week. Internet banking option has been very popular not only for customers who want to have some control over their account without having to go to the bank but for banks as well whose man hours have been freed up from performing simple tasks like balance inquiries, account transfers, and the likes because the customer does it himself with banking Internet.
Internet banking options also include virtual banks. This is the truest form of banking Internet simply because these banks only exist online. Internet banking options have become popular because they save customers time and money, which is a very trendy combination. Banking Internet which only exist online means you will have to transfer your money to the new account or else mail a payment via cheque. Uppal, and Kaur (2007) studied the impact of Information Technology on various parameters of bank performance and concluded that Indian banking industry is quickly moving towards IT. The future of e-channels is very bright.
2. II.
3. Overview of Electronic Payments
Markets Globally and in India
The development of an internet-based electronic payment system permits goods and services to be ordered and paid for irrespective of location, thereby providing opportunities for the creation of completely new business structures and sets of global trading relationships. The internet offers the possibility of 'open systems' for payment and settlement than can operate in parallel to existing, more traditional bank based networks. Consequently, online banking has now become a significant aspect of both wholesale and retail financial services.
With the rapid diffusion of the internet, banking in cyberspace is fast becoming an alternative channel to provide banking services and products. Numerous studies have shown that the internet has become the most popular electronic delivery platform for electronic delivery platform for electronic banking (Karjaluoto et al, 2002).
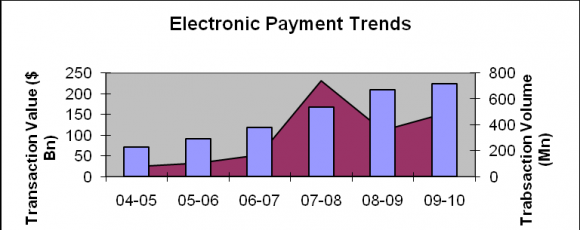
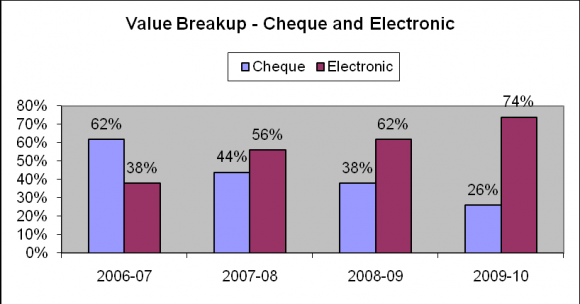
Major highlights of electronic payments markets globally and in India: The payment business in India is currently witnessing a phase of a rapid transition, enabled by the growing acceptance of electronic payment systems across various segments. A look at the electronic payments in India over the years reveals the growth in electronic payments in India both in terms of value as well as volume.
4. Expansion of Banking Branches
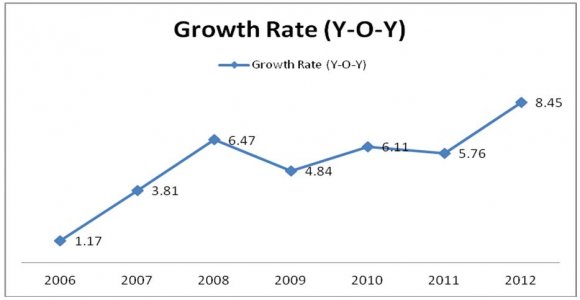
Branch wise Growth status of banks reveals that the rate of growth has been highest for rural banks, followed by semi-urban banks. Thus this throws light on the Govt. policies to provide banking facilities to all citizens in all areas. This is a good sign. Although in absolute numbers there is still quite a lot of difference in bank branches in urban (14248) and metropolitans (13257) compared to 22188 branches in urban areas and 17773 branches in semi-urban areas. Year on year growth of banking branches has been highest (8.85) Branch wise Growth status of private banks as shown in table 2 depicts similar trends to that of public sector banks. The rate of growth is highest for rural sector, viz. 3.23, although this is slightly lower than that of public sector banks. In absolute numbers there is still quite a lot of difference in bank branches in metropolitans (3615) and urban (3569) compared to 4687 branches in semi-urban areas and only 1581 branches in rural areas. Per cent of ATMs to Branches has increased from 110.60 per cent to 268.21 per cent. The growth rate of offsite ATMs is higher than that of on-site ATMs.
Overall growth statistics highlights an increase at the rate of 2.42 per cent.
5. C
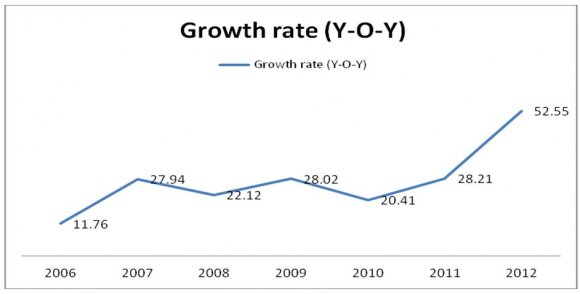
Year on year ATM growth of private sector banks depicts an increasing trend. The growth rates improved from 11.76 percent to 52.55 percent.
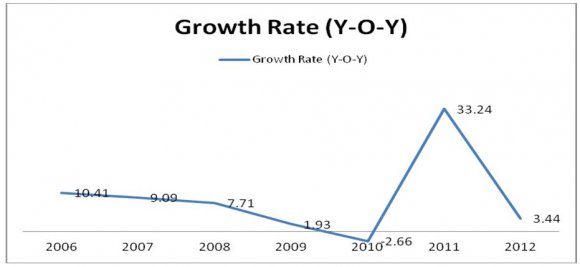
6. Table 7 : Growth Statistics of ATMs in Foreign Sector Banks Growth Statistics of ATMs in Foreign Sector
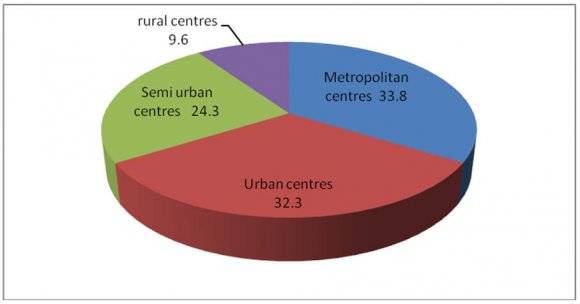
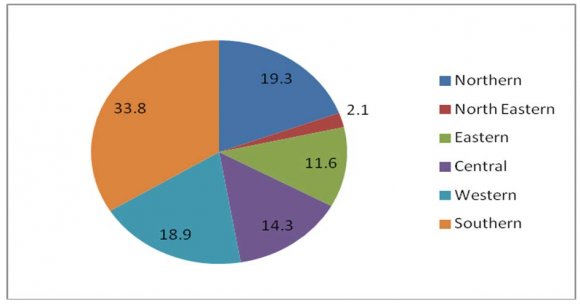
Bank is again indicative of similar trends as observed for public and private sector bank ATMs, i.e. the growth rate is higher for off-site ATMs than for on-site ATMs. Per In case of regional growth, the southern sectors share has been 33.8 and that of Northern region is 19.3.
North-eastern region contributed a smallest share of the pie. Overall results highlight that there is a significant difference between public sector, private sector and foreign banks regarding Number of ATMS as F-value is 11.651and is significant as p<0.001. Post-Hoc test were also conducted and results highlight that that there is significant difference regarding ATM Public Sector Banks and ATM Foreign Sector Banks as p<.001. Regarding ATM Public Sector Banks and ATM Private Sector Banks results highlight that there is no significant difference in the mean score. Post hoc tests for ATMs Private Sector Banks and ATM Public Sector Banks are indicative of the fact that there is no significant difference as already highlighted, but in case of ATM Private Sector Banks and ATMs foreign sector banks there is a significant difference. Post hoc tests for foreign sector banks reveals that in case of both ATMs foreign sector Banks and ATM Public Sector Banks as well as ATMs foreign sector Banks and ATM Public Sector Banks there is a significant difference as p values for both are significant. Thus the hypothesis H 1 : There is significant difference in the means of Number of ATMs of Public, Private and Foreign sector banks has been accepted.
7. b) Relation between Nature of Bank and ATMs
After analyzing a detailed analysis of growth of branches and ATMs the next step was to find the scenario of debit cards.
8. IV.
9. Debit Card & Credit Card
Performance in India a) Debit Card Market in India During 2010-11, the number of debit cards grew at the rate of 25 per cent over the previous year.
? In sync with the trend observed in case of ATMs, nearly three fourths of the total debit cards were issued by PSBs as at end March 2011. ? The share of PSBs in outstanding debit cards witnessed an increase during the recent years, while that of new private sector banks and foreign banks witnessed a decline over the same period. ? However, in absolute terms, the number of outstanding debit cards witnessed an increase for new private sector banks during the recent years years, while that of new private sector banks and foreign banks witnessed a decline over the same period. On the operational side, despite the convenience offered by ATMs in providing banking services, the debit card penetration continued to be low with only 30 per cent of deposit account holders having a debit card. The status of credit card penetration was worse with only less than two per cent of the population having a credit card. Further, the number of outstanding credit cards witnessed a declining trend during the recent years. As these technological advancements improve the pace and quality of banking services, there is a need to make efforts to improve card penetration in the country.
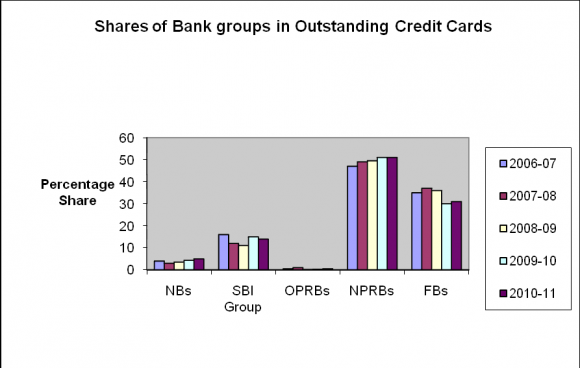
10. b) Credit Card Market in India
The issuance of credit cards facilitates transactions without having to carry paper money. Despite the decline in the number of outstanding number of credit cards, the volume and value of transactions with credit card recorded a growth of 13 per cent and 22 per cent, respectively in 2010-11. New private sector banks and foreign banks accounted for more than 80 per cent of the total outstanding credit cards as at end March 2011. The electronic payment systems such as Electronic Clearing Service (ECS) credit and debit, National Electronic Fund Transfer (NEFT) for retail transactions and Real Time Gross Settlement (RTGS) for large value, improved the speed of financial transactions, across the country.
11. Mobile Banking
India has 700 million (approx) mobile subscribers, but only 240 million individuals with bank accounts, 20 million credit cards, 88,000 bank branches and 70,000 ATMs. Of the households without a bank account, 42% have at least one mobile phone. This is just a snapshot into the penetration that mobile has achieved in a relatively small period of time.
Mobile banking could be a revolution in banking. It has been in the news for quite a while and, very recently, the transaction limit for mobile wallet cards was increased to Rs.50K. Mobile banking in India is set to generate a fee-based income of Rs.202.5 billion (approx. US$4.5 billion) over the next five years, mainly driven by lower transaction costs, favorable regulatory environment and the UID project.
By 2015, US$350 billion in payment and banking transactions could flow through mobile phones, compared with about US$235 billion of total credit-and debit-card transactions today. This forecast depends on the willingness of banks, telecom operators, regulators and consumers collectively to embrace this form of payment.
The RBI introduced operative guidelines for banks for mobile banking transactions in India in October 2008 under the umbrella of the Payments & Settlements Act 2007 with a few revisions and clarifications outlined in subsequent releases. The key highlights of the act are:
? Only rupee based domestic services are permissible, clearly prohibiting the use of crossborder inward and outward transfers. ? Banks are allowed to use the services of business correspondents top extend this facility to customers. ? Only banks with core banking solutions would be permitted to provide mobile banking services on their platform. ? The customer registration for mobile banking is mandatory. ? The mobile banking service offered by banks should be network operator-agnostic and should work across the entire mobile spectrum of operators. ? To ensure inter-operability between banks, message formats such as ISO 8583 were to be adopted for transactions.
There are essentially two mobile banking metamarkets in India: rural and urban. Over the next five years, unbanked rural markets could begin to rival the urban market in size. In urban areas, many consumers have bank accounts, but still rely on cash for 90% to 95% of small-ticket transactions.
Mobile payments would not only seek to change the cash-based nature of transactions, but also would be a tremendous convenience for these consumers. The mobile banking industry in India is ready to take off, especially with the ecosystem players, i.e., operators, banks and mobile manufacturers coming together and launching pilot services.
The Inter Bank Mobile Payment Service (IMPS) facility was launched with much fanfare in November 2010, under the aegis of the National Payment Corporation of India (NPCI). It promised an instant interbank electronic fund transfer service that customers could conveniently access using their mobile phones. However, although the facility is being offered by more than 20 banks across the country, the adoption rate has been low. Industry analysts have attributed this to the fact that the service in its current format is custom-made for Smartphone users who can download an application from their respective banks and use it to make a fund transfer. Users with basic phones have the option of transferring funds via an SMS, which limits the transaction value. With more than 600 million connections and over 15 million being added each month, currently just 5% of mobile phone subscribers are registered for the service. Even among the registered users, only a small fraction uses it regularly. Approximately 680,000 transactions worth Rs.610 million (US$13.55 million) are conducted every month.
12. a) Developments in the Mobile Banking Arena
RBI has been insisting repeatedly that mobile payments in India have to be driven by a bank-led model. This has prompted several stakeholders such as handset manufacturers, network providers and telecom operators to enter into strategic tie ups with banks to develop a scalable model. Several offerings have emerged or are around the corner over the past year. With an objective to deliver higher value for the savings account customers, banks have designed savings accounts with an auto sweep facility with the help of technology. The product feature works in a way that when the balance exceeds a given threshold value, the same is converted into a fixed deposit. If the balance falls, the fixed deposit is automatically broken and the balance is automatically credited back to the savings account of the customer. This facility provides a greater yield for customers on ideal funds and help banks retain low-cost deposits.
13. b) Smart Cards
The processor type smart cards with built-in integrated circuits (ICs) or microchips offer a wide range of transactional opportunities even from remote areas. Smart cards are extensively used for transactions such as cash withdrawals from ATMs, payment of bills and online purchases.
14. c) Virtual Banks
Multimedia technology has been quite effective in bringing banking services to the doorstep of its customers. The customer-activated terminal (CAT) or self-banking kiosks are an interactive multimedia display unit, housed in a small enclosure, which typically consists of a computer workstation, monitor, video disk player and a card reader. It enables customers to browse through the information and use the available banking services at their own speed. Some banks have established virtual or self-banking branches where the customer enters the branch, explores services on the touch screen and at any time calls up members of the bank staff by video conferencing. While customers get the convenience of 24X7 banking, the bank saves in heavy real estate and manpower costs when compared to establishing a branch.
15. d) Electronic Funds Transfers
Real time gross settlements (RTGS) and national electronic funds transfer (NEFT) have transformed the way funds transfers are done. Moving from three to four days for clearing and funds transferred, banks have moved to real-time transfers using online channels and mobile phones.
16. VII.
17. Conclusion
Major developments in banking sector due to technology are taking place. In the face of the new competitive pressures, inherent rigidities in public sector banks to enhance serious challenges. The gap between partially using IT in banks and fully using IT in banks has widened. Financial sector reforms experienced that as compared to new private sector banks and foreign banks, in public sector banks very less IT has taken place. This IT in new private sector and foreign banks is becoming threat and also motivation for Indian public sector banks. Thus in this competition those banks will survive in the future which will manage technology infrastructure and innovations in the products and services offered by them.
18. Bibliography

| S. No. | Year | Branches | |||||
| Rural | Semi-urban | Urban | Metro-politan | Total | Growth Rate | ||
| (Y-O-Y) | |||||||
| 1 | 2005 | 19068 | 11371 | 9269 | 7580 | 47288 | - |
| 2 | 2006 | 18219 | 11146 | 9439 | 9039 | 47843 | 1.17 |
| 3 | 2007 | 18112 | 11728 | 10168 | 9658 | 49666 | 3.81 |
| 4 | 2008 | 18526 | 12685 | 11260 | 10409 | 52880 | 6.47 |
| 5 | 2009 | 18941 | 13504 | 11994 | 10999 | 55438 | 4.84 |
| 6 | 2010 | 19567 | 14595 | 12920 | 11743 | 58825 | 6.11 |
| 7 | 2011 | 20387 | 15978 | 13569 | 12277 | 62211 | 5.76 |
| 8 | 2012 | 22188 | 17773 | 14248 | 13257 | 67466 | 8.45 |
| Overall Growth Rate | 3.41 | 2.15 | 1.67 | 1.21 | 1.90 | ||
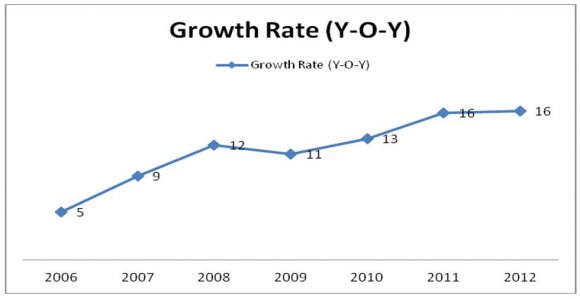
| S No | Year | Rural | Semi-urban | Urban | Metropolitan | Total | Growth Rate (Y-O-Y) |
| 1 | 2005 | 1102 | 1847 | 1739 | 1508 | 6196 | |
| 2 | 2006 | 1033 | 1769 | 1910 | 1804 | 6516 | 5 |
| 3 | 2007 | 985 | 2064 | 2118 | 1936 | 7103 | 9 |
| 4 | 2008 | 1031 | 2368 | 2417 | 2159 | 7975 | |
| 5 | 2009 | 1113 | 2638 | 2715 | 2411 | 8877 | |
| 6 | 2010 | 1201 | 3037 | 3027 | 2762 | 10027 | |
| 7 | 2011 | 1311 | 3814 | 3315 | 3162 | 11602 | |
| 8 | 2012 | 1581 | 4687 | 3569 | 3615 | 13452 | |
| Overall Growth Rate | 3.23 | 2.22 | 1.61 | 1.67 | 1.94 | ||
| S No. | Year | Rural Semi-urban Urban | Metropolitan | Total | Growth Rate (Y-O-Y) | ||
| 1 | 2005 | 0 | 0 | 38 | 204 | 242 | |
| 2 | 2006 | 0 | 1 | 37 | 221 | 259 | 7.02 |
| 3 | 2007 | 0 | 2 | 44 | 227 | 273 | 5.41 |
| 4 | 2008 | 0 | 2 | 49 | 226 | 277 | 1.47 |
| 5 | 2009 | 4 | 4 | 52 | 233 | 293 | 5.78 |
| 6 | 2010 | 5 | 6 | 60 | 237 | 308 | 5.12 |
| 7 | 2011 | 7 | 8 | 61 | 241 | 317 | 2.92 |
| 8 | 2012 | 7 | 8 | 61 | 246 | 322 | 1.58 |
| Overall Growth Rate | 2.25 | 1.72 | 1.68 | 1.00 | 1.30 | ||
| Branch-wise status of Foreign sector banks is | |||||||
| indicating that although foreign banks had their | |||||||
| presence in metropolitan and urban areas in 2005. They | |||||||
| made their presence in rural areas in 2009 with four | |||||||
| banks and now there are seven banks. Foreign banks in | |||||||
| semi-urban areas have improved from 1 in 2006 to 8 in | |||||||
| 2012. | |||||||
| Growth Rate (Y-O-Y) | ||||||||
| Growth Rate (Y-O-Y) | ||||||||
| 7.02 | ||||||||
| 5.41 | 5.78 | 5.12 | ||||||
| 2.92 | ||||||||
| 1.47 | 1.58 | |||||||
| 2006 | 2007 | 2008 | 2009 | 2010 | 2011 | 2012 | ||
| Groups | Mean | F-Test | Post Hoc Test (Levene Test) | |||||
| (S.D.) | (p-value) | Groups | p-Value | Remarks | ||||
| Public Sector Bank | 55202.13 | 355.451 | Private Sector Bank | .000 | There is significant difference | |||
| Branches | p <.001 | Branches | ||||||
| (7226.329) | Foreign Sector Bank | .000 | There is significant difference | |||||
| Branches | ||||||||
| Private Sector Bank | 8968.50 | Public Sector Bank | .000 | There is significant difference | ||||
| Branches | Branches | |||||||
| (2572.784) | Foreign Sector Bank | .002 | There is significant difference | |||||
| Branches | ||||||||
| Foreign | Sector | 286.38 | Public Sector Bank | .000 | There is significant difference | |||
| Bank Branches | Branches | |||||||
| (28.545) | Private Sector Bank | .002 | There is significant difference | |||||
| Branches | ||||||||
| S No | Year | Public Sector Banks | Private Sector Banks | Foreign Sector Banks |
| 1 | 2005 | 9992 | 6853 | 797 |
| 2 | 2006 | 12608 | 7659 | 880 |
| 3 | 2007 | 16329 | 9799 | 960 |
| 4 | 2008 | 21788 | 11967 | 1034 |
| 5 | 2009 | 27277 | 15320 | 1054 |
| 6 | 2010 | 40680 | 18447 | 1026 |
| 7 | 2011 | 49487 | 23651 | 1367 |
| 8 | 2012 | 58193 | 36079 | 1414 |
| Overall Growth Rate | 1.92 | 2.18 | 1.80 | |
| Year 2014 | ||||||||
| Volume XIV Issue IV Version I | ||||||||
| ( ) C | ||||||||
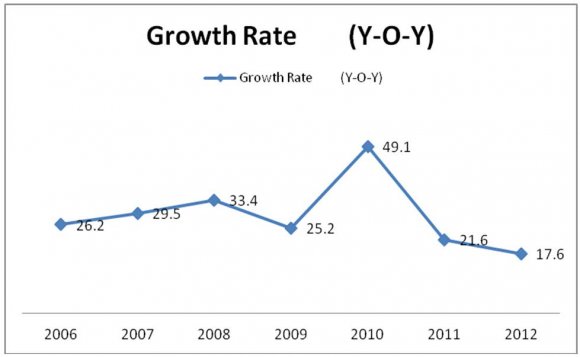
| S No. 1 2 3 4 5 6 7 | Year 2005 2006 2007 2008 2009 2010 2011 | On-site Off-site 4753 5239 6587 6021 10289 6040 12902 8886 17379 9898 23797 16883 29795 19692 | Total 9992 12608 16329 21788 27277 40680 49487 | Public Sector ATMs Growth Rate (Y-O-Y) Per cent of Off-site to total ATMs -52.4 26.2 47.8 29.5 37.0 33.4 40.8 25.2 36.3 49.1 41.5 21.6 39.8 | Per cent of ATMs to Branches 21.1 26.4 32.9 41.2 49.2 69.2 79.5 | Global Journal of Management and Business Research | ||
| 8 | 2012 | 34012 | 24181 | 58193 | 17.6 | 41.6 | 86.3 | |
| Overall Growth Rate | 1.78 | 2.15 | 1.92 | |||||
| S. No. | Year | On-site | Off-site | Total | Growth rate | Per cent of | Per cent of |
| (Y-O-Y) | Off-site to | ATMs to | |||||
| Total ATMs | Branches | ||||||
| 1 | 2005 | 2683 | 4170 | 6853 | - | 60.85 | 110.60 |
| 2 | 2006 | 3309 | 4350 | 7659 | 11.76 | 56.80 | 117.54 |
| 3 | 2007 | 4258 | 5541 | 9799 | 27.94 | 56.55 | 137.96 |
| 4 | 2008 | 5315 | 6652 | 11967 | 22.12 | 55.59 | 150.06 |
| 5 | 2009 | 6996 | 8324 | 15320 | 28.02 | 54.33 | 172.58 |
| 6 | 2010 | 8603 | 9844 | 18447 | 20.41 | 53.36 | 183.97 |
| 7 | 2011 | 10648 | 13003 | 23651 | 28.21 | 54.98 | 203.85 |
| 8 | 2012 | 13249 | 22830 | 36079 | 52.55 | 63.28 | 268.21 |
| Overall Growth Rate | 1.86 | 2.42 | 2.18 | ||||
| S No. | Bank Group | Outstanding Number of Debit cards (in millions) | |||
| Year--? | 2007-08 | 2008-09 | 2009-10 | 2010-2011 | |
| I | Public sector banks | 64.33 | 91.70 | 129.69 | 170.34 |
| a) | Nationalised banks | 28.29 | 40.71 | 58.82 | 80.27 |
| b) | SBI group | 36.04 | 50.99 | 70.87 | 90.07 |
| II | Private sector banks | 34.10 | 41.34 | 47.85 | 53.58 |
| a) | Old private sector banks | 5.34 | 7.09 | 9.81 | 12.44 |
| b) | New private sector banks | 28.76 | 34.25 | 38.04 | 41.14 |
| III | Foreign banks | 4.02 | 4.39 | 4.43 | 3.92 |
| Sr.No. | Bank Group | Outstanding Number of Debit cards (in millions) | |||
| Year--? | 2007-08 | 2008-09 | 2009-10 | 2010-2011 | |
| I | Public sector banks | 3.93 | 3.44 | 3.26 | 3.08 |
| a) | Nationalised banks | 0.72 | 0.72 | 0.73 | 0.78 |
| b) | SBI group | 3.21 | 2.72 | 2.53 | 2.30 |
| II | Private sector banks | 13.29 | 12.18 | 9.50 | 9.32 |
| a) | Old private sector banks | 0.04 | 0.06 | 0.06 | 0.04 |
| b) | New private sector banks | 13.25 | 12.12 | 9.44 | 9.28 |
| III | Foreign banks | 10.33 | 9.08 | 5.57 | 5.64 |
| NFC-enabled handsets and acceptance capabi- | |
| lities at merchant outlets. There are several players | |
| in the space of financial inclusion such as FINO, | |
| ATOM, Eko and ALW who offer a bouquet of | |
| services such as deposits, cash withdrawals and | |
| payment & transfer transactions via the mobile | |
| channel. | |
| b) Telecommunication Operator Bank Tie-ups | |
| Following three of India's largest mobile | |
| operators have tied up with India's largest banks to offer | |
| a bouquet of mobile-based banking and financial | |
| services to their customers: | |
| 1. Airtel and State Bank of India: A joint venture | |
| company has been set up that envisages opening | ? RBI came up with the regulation of an additional |
| bank accounts, cashless transfers, cashless | factor across IVR and mobile channels. This |
| spending and payment facilities, targeting the rural | affected mobile service aggregators such as |
| and urban poor. Customers would be offered a no- | ngpay, Mchek and Paymate. |
| frills banking account from SBI, across Airtel's 1.5 | ? Several new banks have come up with their mobile |
| million+ retailer network. Both partners have | banking offering through java-based applications. |
| envisaged investing more than Rs.1 billion in this | Newer channels such as USSD and SMS have also |
| enterprise. The JV plans to acquire more than 2 | gained in prominence after RBI increased the limit |
| million accounts annually. | for unencrypted transactions over mobile channel |
| 2. Vodafone and the ICICI Bank: Similar arrangement | to Rs.5,000 per day. |
| being entered offering financial products ranging | ? Banks such as SBI offer certain value-added |
| from savings accounts, prepaid instruments and | services such as prepaid mobile recharge, which |
| credit products through a mobile phone platform. | has been a hugely successful functionality. SBI |
| 3. | boasts of more than 1 million customers in its |
| mobile banking platform freedom by virtue of | |
| balanced service offerings as well as effective | |
| customer communication. | |
| ? Apparently, the regulator believes that mobile | |
| banking is yet to show remarkable growth even | |
| after the daily transaction limits have been raised to | |
| Rs. 50,000 per day per customer. Apart from major | |
| banks such as SBI and ICICI, other banks are still | |
| to gain numbers in terms of volume and value of | |
| transactions. | |
| ? Nokia Money launched its services with Yes Bank | |
| and Union Bank of India to provide financial | |
| services to customers. Nokia plans to use its | |
| distribution network coupled with the financial | |
| prowess of the banks to provide a service of its | |
| kind. | |
| ? Airtel received approval to issue prepaid | |
| instruments from regulators and launch it in the | |
| name of Airtel Money. Other mobile operators too | |
| are defining models wherein payment and/or | |
| transfer enabling instruments would be launched | |
| either on their own or with banks, leveraging the | |
| principles of business correspondents. | |
| ? In the area of proximity payments, Citibank, in | |
| conjunction with Vodafone and Nokia conducted | |
| an NFC (near field communication)-based mobile | |
| payments trial in Bangalore, which saw | |
| considerable success. However, the scalability | |
| would depend on the proliferation and adoption of |