1. Introduction
ustainability is currently a burning issue and a major cause of concern across the globe. At the World Commission on Environment and Development (WCED), Brundtland (1987) defined sustainability as -"meeting the needs of the present generation without compromising the ability of future generations to meet their own needs." The interest of investors in company's non-financial performance has grown significantly over the past few years (Ernst & Young, 2009). In the wake of increased regulations and growth in level of awareness of stakeholders, the concept of corporate sustainability has been assuming great importance. World Business Council for Sustainable Development (2002) defined Corporate Sustainability as -"the commitment of business to contribute to sustainable economic development, and to work with employees, their families, the local community and society at large to improve their quality of life." Today, the firms should take accountability for various beneficial and harmful impacts of their activities on the overall society and environment in which they exist. Moreover, the firms should make proper disclosure of these impacts in an appropriate sustainability report, which provides a detailed description of their governance structure, stakeholder engagement approach and triple bottom line performance. Elkington (1998) developed the term 'triple bottom line' to emphasize on three aspects -people (social), profits (economic) and planet (environmental). Global Reporting Initiative (2011) defines Sustainability Reporting as -"the practice of measuring, disclosing, and being accountable to internal and external stakeholders for organizational performance towards the goal of sustainable development."
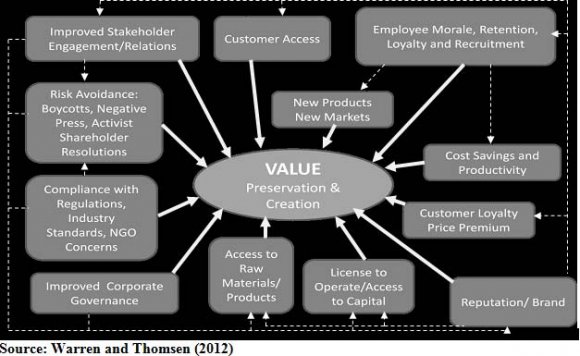
It is widely believed and suggested by researchers that in today's dynamic and complex business environment, the corporate sustainability is likely to influence corporate profitability and overall performance. It lays a foundation for preserving and enhancing value of firm. The firms reap plenty of strategic benefits as a result of embedding sustainability in their core strategies. These various benefits of corporate sustainability are shown in Figure 1 below. Corporate Sustainability and its impact on financial performance have emerged as important areas for research in recent years. Various studies have been performed over the last decade for examining this relationship. However, the results have been mixed and inconclusive. Moreover, most of the previous studies have been conducted in the context of developed countries (like US, Europe, UK, Australia, etc.). Therefore, this paper attempts to analyze the impact of overall sustainability and its four major components on corporate financial performance in an Indian context.
2. II.
3. Objectives of Study
The primary objective of this paper is to find "whether sustainable companies are more profitable or not". Some specific objectives have been formulated to achieve this main object, which are as follows:
? To provide an overview of the concept of corporate sustainability and its various components. ? To analyze whether companies with higher sustainability ratings are more profitable or not.
4. III. Concept of Corporate Sustainability
As per the report by Mays (2003),'Corporate Sustainability' means creating long-term shareholder value by embracing opportunities and managing risks arising from social, environmental and economic factors. The Mays Report also specified advantages of corporate sustainability. Sustainable behavior adds value to commercial endeavor and makes for good business sense. It is specifically a helpful instrument to manage corporate image. It helps in assessing the capabilities and effectiveness of business administration and management. It leads to shift in the organizational focus from short-term to long-term goals. Transparency is an essential element of corporate sustainability. It can be assessed along various dimensions like: energy efficiency, community relations, eco design, materials efficiency, product recyclability, and employee relations. The four major components of corporate sustainability have been described in
5. Related Theory
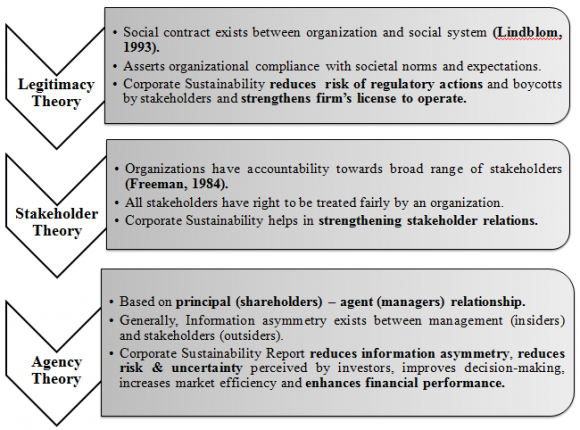
There are three major theories, namely, Legitimacy Theory, Stakeholder Theory and Agency Theory, which suggest that companies should be sustainable and should incorporate corporate sustainability in their core strategic goals. The companies should disclose their sustainability performance in a proper sustainability report. These theories primarily suggest positive relationship between corporate sustainability and company performance. These theories are briefly shown in Figure 2
6. 4)
7. GOVERNANCE
The Governance Component covers disclosure of policies, procedures, board independence and diversity, executive compensation and evaluation of company's culture of ethical leadership and compliance. This component rates factors such asalignment of corporate policies and practices with sustainability goals; transparency to stakeholders; integration of sustainability principles from top down into day-to-day operations of company. Governance focuses on how management is committed to sustainability and corporate responsibility at all levels.
Leadership ethics, board composition, executive compensation, transparency and reporting, and stakeholder treatment.
8. Global Journal of Management and Business Research
9. Hypotheses
Based on theoretical arguments and review of literature, and keeping the research objectives in mind, the following five hypotheses have been formulated and these are shown in Table 3 below.
10. Research Methodology
The present study makes use of secondary data. The average data over a period of two years from FY 2010-11 to FY 2011-12 has been used to enable cross-sectional analysis. A series of statistical tools like -multiple regression, correlation, t-test and F-test have been used to analyze the data and to investigate the impact of corporate sustainability on financial performance.
11. a) Sample Description
The following criteria have been used to select companies eligible to be included in sample:
Companies continuously included in S&P CNX Nifty 50 Index from 1st April, 2010 to 31st March, 2012 = 45 Thus, the final sample comprises of nonfinancial companies; listed on the NSE; which have continuously been included in NIFTY 50 Index during 1st April, 2010 to 31st March, 2012, with easily available financial and sustainability data, and which issue sustainability report as per GRI guidelines. The 20 sample companies and the industry to which they belong are shown below in Table 4. Five Accounting-based measures, namely, Return on Assets (ROA), Return on Equity (ROE), Return on Capital Employed (ROCE), Profit before Tax (PBT), and a growth variable -Growth in Total Assets (GTA), have been used as proxies for financial performance. Accounting-based measures have been used because the audited accounting data is likely to be authentic and credible and is not influenced by market perceptions or speculations, and is thus considered less noisy in returns, share prices, etc. (Lopez et al., 2007). Overall Sustainability Rating (OSR), Community Performance Rating (COM), Employees Performance Rating (EMP), Environmental Performance Rating (ENV) and Governance Performance Rating (GOV) have been used as proxies for sustainability performance of company.
The financial data has been obtained from company's website, audited financial statements, annual reports and Moneycontrol.com. Corporate Sustainability, governance, community, employee and environment ratings data have been obtained from "CSRHub database", which claims to be world's largest corporate sustainability ratings database and principally adheres to GRI guidelines.
Further, we controlled for size of firm because larger firms are likely to have higher profitability as they have greater resources for investing in profitable ventures. We use natural log of total assets as proxy for firm size.
12. c) Research Model
This research paper tests two different models using Multiple Regression Analysis as statistical tool in IBM SPSS Statistics software, in order to examine and analyze the relationship between corporate sustainability and financial performance. These models are described in the following section.
13. i. First Model
The first model intends to examine the impact of overall sustainability rating of company (independent variable -OSR) on the financial performance of firm (dependent variables -ROA, ROE, ROCE, PBT, and GTA); while controlling for size of firm (SIZE). Five regression equations shall be tested in this model, which are as follows: ROA = c + b1.OSR + b2.SIZE
(1) ROE = c + b1.OSR + b2.SIZE
(2) ROCE = c + b1.OSR + b2.SIZE
(3) PBT = c + b1.OSR + b2.SIZE (4) GTA = c + b1.OSR + b2.SIZE
ii. Second Model
The second model aims at examining separately the impact of four major components of corporate sustainability (Community, Employees, Environment and Governance) on company's financial performance, while controlling for size of firm. The five regression equations to be tested in this model are as follows:
14. Global
VIII.
15. Data analysis and Results
The descriptive statistics for various variables used in this study have been shown in Table 5 below.
16. Table 5 : Descriptive statistics
From Table 5, we observe that the mean value of Overall Sustainability Rating is only 52.95% and ratings along four components of sustainability are also approximately 50%. This highlights that Indian companies need to take strong steps towards sustainability to improve their sustainability performance ratings. From Table 6, we observe that all p-values are more than .05, while most of beta values (b1) are positive. Thus, Overall Sustainability Rating (OSR) has positive but insignificant impact on financial performance of company. Thus, we accept the first null hypothesis Ho1 and reject the first alternate hypothesis Ha1.
17. Variables
18. C
The results of first model regarding impact of overall sustainability rating on financial performance of company have been summarized in Table 6 below.
The results of second model regarding impact of four components of sustainability on financial performance of company have been summarized in Table 7 below.
19. Conclusions and Discussion
The statistical results reveal that corporate sustainability as a whole has no significant influence on financial performance. Further, corporate sustainability influences some of the financial performance measures positively (ROA, PBT & GTA), while others negatively (ROE and ROCE). Our result confirms to the findings of many existing researches which argue that corporate sustainability has no significant association with firm performance (Buys et al., 2011;Manescu, 2011), no significant impact in short-term (Adams et al., 2012) and that the varying effects of different dimensions of sustainability may negate and offset each other leading to no significant influence on financial performance (Galema et al., 2008;Statman & Glushkov, 2009;Brammer et al., 2006).
Further investigation of the impact of each component of sustainability separately on company's financial performance provides clearer results. We find that all components except Community, i.e., Employees, Environment and Governance, have significant but varying association with financial performance. Governance and Community dimensions have positive influence, while Employees and Environment dimensions have negative influence on financial performance.
The present study also reveals insignificant positive association between corporate sustainability and growth of firm. This finding is in consonance with Kapoor and Sandhu (2010). This may be due to the reason that growth of a firm is dependent on other factors like product quality, price, marketing strategy, etc. apart from sustainability activities performed by firm. The control variable (firm size) comes out to be significant for financial performance. This result is in consonance with our expectation and with those observed by Guindry and Patten (2010).
Our research result that sustainability performance along employees, environment and governance dimensions does significantly influence company's financial performance may support company's decision to improve its performance in managing sustainability. Companies should understand that improving sustainability performance is as important as improving the financial performance. A company needs to be concerned towards the needs of future generations in running the business, in order to ensure its survival in the long-run.
X.
20. Limitations of Study
The present study is subject to certain limitations. Firstly, the sample size is small (i.e. 20 companies). Secondly, the time frame of research is short (i.e. 2 years). Thirdly, market-based measures of financial performance are not considered in this paper. Lastly, the study ignores control variables like age of firm, growth of firm, capital intensity, leverage, risk, R&D intensity, industry type, etc. that may have significant influence on this relationship.
The results of study should be interpreted in light of these limitations and the future researchers should attempt to overcome them while doing further research in this area.

| 2013 |
| ear |
| Y |
| Volume XIII Issue XI Version I |
| ( ) |
| Global Journal of Management and Business Research |
| Source: CSRHub (www.csrhub.com) |
| IV. |
| Components | Description | |
| 1) | COMMUNITY | The Community Component covers the company's commitment and effectiveness within local, national and global community in which it |
| Human rights, supply chain, product quality & safety, product sustainability, community development, philanthropy. | does business. It reflects company's citizenship, charitable giving and volunteerism. This component covers company's human rights record and treatment of its supply chain. It also covers the environmental and social impacts of company's products and | |
| services, and development of sustainable products, processes and | ||
| technologies. | ||
| 2) | ||
| Diversity, labor rights, treatment of unions, | ||
| compensation, benefits, training, health, | ||
| worker safety | ||
| 3) | ||
| Environmental policy, environmental | ||
| reporting, waste management, resource | ||
| management, energy use, climate change | ||
| policies and performance. | ||
| 2013 | |||||
| ear | |||||
| Y | |||||
| Volume XIII Issue XI Version I | |||||
| ( ) C | |||||
| Global Journal of Management and Business Research | S.No. 1 2 | Study & Country Jones (2005) -Australia Van de Velde et al. | Measure of Corporate Sustainability GRI Sustainability Reporting Index Score Vigeo Sustainability Scores on - | Measure of Financial Performance Market adjusted returns; other financial ratios; and financial distress probability scores. Average Monthly | Relationship Mixed Results with different measures of company performance Positive, but not |
| (2005) | Human Resources, Environment, | Returns on portfolio | significant | ||
| -Europe | Customers & Suppliers, | ||||
| Community & Society, and | |||||
| Corporate Governance | |||||
| 3 | Brammer et al. (2006) | Composite/Aggregate | Stock Returns | Negative | |
| -UK | Sustainability Score from EIRIS | ||||
| database |
| S.N. | Sample Companies | Industry |
| 1 | Bharat Petroleum Corporation Ltd. (BPCL) | Petroleum Refineries |
| 2 | Bharti Airtel Ltd. | Telecommunications |
| 3 | GAIL (India) Ltd. | Natural Gas Distribution |
| 4 | Hindalco Industries Ltd. | Mining (Except Oil & Gas) |
| 5 | Hindustan Unilever Ltd. | Food Products |
| 6 | Infosys | IT & Network Services |
| 7 | ITC | Conglomerates (FMCG, Hotels and Agri Business) |
| 8 | Larsen & Toubro Ltd. | Heavy & Civil Engineering Construction |
| 9 | Mahindra & Mahindra Ltd. | Motor Vehicle Manufacturing |
| 10 | Maruti Suzuki India Ltd. | Motor Vehicle Manufacturing |
| 11 | NTPC Ltd. | Electric & Gas Utilities |
| 12 | Oil & Natural Gas Corporation Ltd. (ONGC) | Oil & Gas Extraction |
| 13 | Power Grid Corporation of India Ltd. | Electric & Gas Utilities |
| Chemicals, Plastics & | ||
| 14 | Reliance Industries Ltd. | Rubber Products |
| Manufacturing | ||
| 15 | Sterlite Industries (India) Ltd. | Mining (Except Oil & Gas) |
| 16 | Tata Consultancy Services Ltd. (TCS) | IT & Network Services |
| 17 | Tata Motors Ltd. | Motor Vehicle Manufacturing |
| 18 | Tata Power Co. Ltd. | Electric & Gas Utilities |
| 19 | Tata Steel Ltd. | Steel Manufacturing |
| 20 | Wipro Ltd. | IT & Network Services |
| b) Variable Description and Data Sources | ||
| Beta | |||||||
| Particulars | R | R 2 | Adjusted R 2 | F | Significance of F | Coefficient for OSR | p-value |
| (b 1 ) | |||||||
| ROA | .420 | .176 | .079 | 1.817 | .193 | .316 | .381 |
| ROE | .568 | .323 | .243 | 4.050 | .036 | -.607 | .220 |
| ROCE | .520 | .270 | .184 | 3.148 | .069 | -.441 | .548 |
| PBT | .671 | .451 | .386 | 6.973 | .006 | 30.584 | .887 |
| GTA | .436 | .190 | .095 | 1.992 | .167 | .155 | .571 |
| Particulars | ROA | ROE | ROCE | PBT | GTA | |
| R | .730 | .769 | .760 | .826 | .690 | |
| R 2 | .533 | .592 | .577 | .683 | .475 | |
| Adjusted R 2 | .367 | .446 | .426 | .570 | .288 | |
| F | 3.201 | 4.064 | 3.825 | 6.036 | 2.538 | |
| Significance of F | .039 | .017 | .021 | .004 | .078 | |
| Beta Coefficient for COM 1 ) | 1.182 | 1.106 | 1.833 | 260.220 | .314 | |
| Beta Coefficient for EMP (b 2 ) | -1.526 | -1.684 | -2.901 | -886.278 | .154 | |
| Beta Coefficient for ENV (b 3 ) | -1.228 | -2.483 | -3.337 | -464.416 | .871 | |
| Beta Coefficient for GOV (b 4 ) | 1.381 | 1.926 | 3.026 | 827.701 | -1.073 | |
| p-value for COM | .072* | .214 | .167 | .494 | .537 | |
| p-value for EMP | .011** | .036** | .017** | .014** | .722 | |
| p-value for ENV | .066* | .012** | .020** | .237 | .106 | |
| p-value for GOV | .024** | .025** | .018** | .027** | .031** | |
| Note: | ||||||
| **. Significant @ 5% level of significance | ||||||
| *. Significant @ 10% level of significance | ||||||
| The following conclusions can be inferred from | ||||||
| analysis of Table 7: | ||||||
| ? Community-related performance has insignificant | ||||||
| positive relationship with company's financial | ||||||
| performance. | Hence, the second alternate | |||||
| hypothesis (Ha2) is rejected. | ||||||
| ? Employee-related performance has significant | ||||||
| negative relationship with company's financial | ||||||
| performance. Hence, the third alternate hypothesis | ||||||
| (Ha3) is accepted. | ||||||
| ? Environment-related performance has significant | ||||||
| negative relationship with company's financial | ||||||
| performance. | Hence, the fourth alternate | |||||
| hypothesis (Ha4) is accepted. | ||||||
| ? Governance-related performance has significant | ||||||
| positive relationship with company's financial | ||||||
| performance. Hence, the fifth alternate hypothesis | ||||||
| (Ha5) is accepted. | ||||||
| The results of Hypothesis Testing are shown below in | ||||||
| Hypothesis (Alternate) | Accept/Reject |
| Ha1 | Reject |
| Ha2 | Reject |
| Ha3 | Accept |
| Ha4 | Accept |
| Ha5 | Accept |
| IX. |