1. Introduction
n recent years, companies have reduced their dependency on traditional accounting systems by developing activity-based cost management systems. Traditional costing systems have a tendency to assign indirect costs based on something easy to identify (such as direct labor hours). This method of assigning costs can be very inaccurate because there is no actual relationship between the cost pool and the cost driver. This can make indirect costs allocation inaccurate.
Initially, managers viewed the ABC approach as a more accurate way of calculating part costs. But ABC has emerged as a tremendously useful guide to management action that can translate directly into higher profits. The Activity Based Costing (ABC) is designed to assign costs to activities which enable more accurate cost information.
ABC reveals the links between performing particular activities and the demands those activities make on the organization's resources, so it can give managers a clear picture of how parts, brands, customers, facilities, regions, or distribution channels both generate revenues and consume resources. The profitability picture that emerges from the ABC analysis helps managers focus their attention and energy on improving activities.
2. a) Resources and Various Cost Drivers
An activity is a specific task or action of work done. It can be a single action or an aggregation of several actions. For example: moving inventory from workstation 'A' to workstation 'B'. B is an activity that may require only one action. Production set-up is an activity that may include several actions.
3. i. Activity Driver
The best single quantitative measure of the frequency and intensity of the demand placed on an activity by cost objects or other activity. It is used to assign activity costs to cost objects or to other activities.
4. ii. Activity Work
This is performed by people, equipment, technologies or facilities. Activities are usually described by the 'action-verb-adjective-noun' grammar convention. Activities may occur in a linked sequence and activity-toactivity assignments may exist.
iii. Cost Object Any part, service, customer, contract, project, process or other work unit for which a separate cost measurement is desired. iv. Resource A resource is an economic element needed or consumed in performing activities. For example: Salaries and supplies are resources needed or used in performing manufacturing activities.
5. v. Resource Driver
The best single quantitative measure of the frequency and intensity of the demand placed on a resource by other resources, activities, or cost objects. It is used to assign resource costs to activities, and cost objects, or to other resources.
6. Resources Economic
Elements that are applied or used in the performance of activities or directly support cost object. They include people, materials, supplies, equipment, technologies and facilities.
7. b) Explanations to Resources and Various Cost Drivers
A cost driver is a factor that causes or relates to a change in the cost of an activity. Because cost drivers cause or relate to cost changes, measured or quantified amounts of cost drivers are excellent bases for assigning resource costs to activities and for assigning the cost of activities to cost objects. A cost driver is either a resource consumption cost driver or an activity consumption cost driver.
A resource consumption cost driver is a measure of the amount of resources consumed by an activity. It is the cost driver for assigning a resource cost consumed by or related to an activity to a particular activity or cost pool. Examples of resource consumption cost drivers are the number of items in a purchase or sales order, changes in part design, size of factory buildings, and machine hours.
An activity consumption cost driver measures the amount of an activity performed for a cost object. It is used to assign activity cost pool costs to cost objects. Examples of activity consumption cost drivers are the number of machine hours in the manufacturing of part X, or the number of batches used to manufacture Part Y.
Value-added activity: Value-added activities change the form, fit or function of a part or service. These are things for which the customer is willing to pay.
Non-Value-added activity: Activities that do not add value to the process are called non-value added activities. These activities do not help create conformance to the customer's specifications, and are something for which the customer would be unwilling to pay for. The difference of value added activities and non value added activities are tabulated in table 1. No merit or worth to an activity as defined by the customer.
8. 2.
Activities must be performed to meet customer's wants and needs.
The activity does not need to be done to generate output.
9. 3.
Actions are value added if the customer cares, if something is physically changing for the best and you do the step right the first time.
It does not add value to the service or part.
10. 4.
Value added activities essentially change the part or service and the customer is willing to pay for them.
In essence it is something the customer is not willing to pay for.
11. 5.
Providing worth or merit to an activity as defined by the customer.
No merit or worth to an activity as defined by the customer.
II.
12. Aims and Objectives of the Study
With ABC, an organization can firmly estimate the cost elements of entire parts and services. That may help inform a company's decision to either. Identify and eliminate those parts and services that are unprofitable and lower the prices of those that are overpriced. Or identify and eliminate production or service processes that are ineffective and allocate processing concepts that lead to the very same part at a better yield. In a business organization, the ABC methodology assigns an organization's resource costs through activities to the parts and services provided to its customers. ABC is generally used as a tool for understanding part and customer cost and profitability based on the production or performing processes. As such, ABC has predominantly been used to support strategic decisions such as pricing, outsourcing, identification and measurement of process improvement initiatives.
Therefore, a study has been carried out to apply this technique in order to derive maximum advantage in a manufacturing setup. The basic intents are as follows: ABC is an economic model that identifies the cost pools or activity centers in an organization and assigns costs to cost drivers based on the number of each activity used. Since the cost drivers are related to the activities, they occur on several levels: (i) Unit level drivers which assume the increase of the inputs for every unit that is being produced. (ii) Batch level drivers which assume the variation of the inputs for every batch that is being produced.
(iii) Product level drivers which assume the necessity of the inputs to support the production of each different type of part. (iv) Facility level drivers are the drivers which are related to the facility's manufacturing process. Users of the ABC system will need to identify the activities which generate cost and then match the activities to the level bases used to assign costs to the parts.
While using the ABC system, the activities which generate cost must be determined and then should be matched to the level drivers used to assign costs to the products.
The implementation of the ABC system has the following steps:
Step 1) Identifying the activities such as machining, inspection etc.
Step 2) Determining the activity costs
Step 3) Determining the cost drivers such as machining hours, number of setups, labour hours etc.
Step 4) Collecting the activity data
Step 5) Computing the product cost
In this case study we are comparing two types of techniques of cost accounting by collecting and analyzing the data of a company which is a pressed component manufacturer. It produces three parts for automobile industry. The Company now has an opportunity to increase its sales due to increased demand. So, it would like to know the true costs of these parts prior to deciding as which item is to be produced more. The calculations are in following steps:
1. Current prices, direct labour hour to produce each of the items, their material costs, and annual production quantities are as under and are shown in Table 2. 2. The company has recorded following expenses last year on its General Ledger Statement and it is shown in Table 3. "True Cost" calculation of parts by Activity Based Costing (ABC) : The three parts being evaluated are Part "A", Part "B" and Part "C". Basic information about these parts is given in Table 5 Activity determination : The staff questionnaire revealed that for indirect work the company has 25 employees and they are in the following work groups as shown in Table 7 Calculation of unit activity costs : It is given in Table 8 Note :
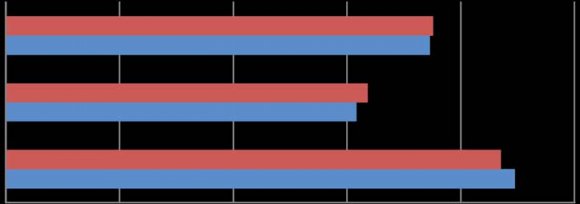
Total indirect cost from general ledger × % activity e.g., Processing orders = 62, 66,000 × 0.24 = 15, 03,840 True cost calculation and Margin % of parts by ABC method is shown in graphs in Fig. 3 Calculation of "true" costs of parts : It is given in Table 10 1.
13. 2.
3.
14. 4.
5.
6.
1.
15. 2.
3.
16. 4.
5.
17. 6.
7. The following conclusions have been made by analyzing the data using traditional cost accounting (TCA) method and true cost calculation by activity based costing (ABC) method:
? In the case of Part 'A' cost calculations, TCA shows a margin % of 25.41 but by calculating it through ABC method, it shows a margin % of 27.49. So there is a difference of 2.08 %. Consequently, we can analyze that Part 'A' shows 2.08% more profit as compared to TCA cost calculation.
? In the case of Part 'B' cost calculations, TCA shows a margin % of 27.50 but it is just 25.14% by calculating it through ABC method. Hence, it has been concluded that the cost calculation by TCA method is declining in profit by 2.36% in actual.
? For Part 'C', TCA indicates that Part 'C' has the best margin % i.e. 35.18%. On the other hand True cost calculation by ABC method also shows that the part C has the best margin % but it is less than the TCA margin %, which is 34.66 %.
? At last, we can conclude that as compared to traditional cost accounting method, Activity based costing method gives us the true costs of the parts.
Hence, the company can get benefited by increasing its sales according to the demand of the products by keeping in view the true costs of the parts which is calculated by ABC method and not the TCA method. Also it can easily decide that which item or part is to be produced more to achieve its goal.


| Point | Value Added activity | Non Value Added Activity |
| 1. | Providing worth or merit to an activity as defined by | |
| the customer. |
| S.NO. | Object | Part A | Part B | Part C |
| Material cost (?) | 400 | 250 | 300 | |
| Direct labour hours | 5 | 3.7 | 4.5 | |
| Annual quantity | 18,000 | 16,000 | 18,500 | |
| Selling Price/each (?) | 1,200 | 850 | 1,150 |
| 2013 | ||||
| ear | ||||
| Y | ||||
| 31 | ||||
| 1. 2. 3. 4. | Volume XIII Issue IV Version I | |||
| (a) (b) (c) 3. Calculation of Part Costs by Traditional Cost Accounting (TCA) Direct labour (?) 1,67,50,000.00 Direct material (?) 24,58,000.00 All other indirect expenses (?) Salaries & wages Fringe benefits Utilities Income tax Equipment rental Postage Depreciation Property tax Maintenance Property insurance Tools Total | 35,43,650 9,48,328 5,17,837 1,58,121 4,30,491 31,195 2,93,233 74,868 1,18,541 56,151 93,585 62,66,000 | Global Journal of Management and Business Research ( ) D | ||
| ? Total labour hours required: | ? Direct labour hour cost =1,67,50,000/2,32,450 | |||
| Part A : 18,000 × 5 | = 90,000 hrs | = 72.05 ?/hr | ||
| Part B : 16,000 × 3.7 = 59,200 hrs | ? Total indirect cost | = 62,66,000 | ? | |
| Part C : 18,500 × 4.5 = 83,250 hrs | ? Over cost/labour hour = 62,66,000.00/2,32,450 | |||
| Total labour hours | = 2, 32,450 hrs | = 26.95 /hr ? | ||
| S.NO. | Object | Part A | Part B | Part C |
| Direct material | 400 | 250 | 300 | |
| Direct labour hour | 5 | 3.7 | 4.5 | |
| Annual quantity | 18,000 | 16,000 | 18,500 | |
| Selling price (?) | 1,200 each | 850 each | 1,150 each | |
| 5. |
| S.NO. | Object | Part A | Part B | Part C | Total |
| Customer orders | 1,800 | 2,000 | 2,500 | 63,00 | |
| Parts manufactured | 18,000 | 16,000 | 18,500 | 52,500 | |
| Work orders | 110 | 100 | 120 | 330 | |
| Set-ups | 110 | 100 | 120 | 330 | |
| Machine hours/unit | 5 | 3.7 | 4.5 | ||
| Material cost/unit (?) | 400 | 250 | 300 | ||
| Labour hours/unit | 5 | 3.7 | 4.5 | ||
| Total labour hours | 18,000 | 16,000 | 18,500 | ||
| Selling price/part (?) | 1,200 | 850 | 1,150 | ||
| 6. | |||||
| Table 7 : Activity Determination | |||||
| S.NO. | Activity | No. of people | % of Total | ||
| Processing orders | 12 | 24% | |||
| Scheduling orders | 10 | 20% | |||
| Die maintenance and storage | 14 | 28% | |||
| Inspection | 08 | 16% | |||
| Shipping (dispatch) orders | 06 | 12% | |||
| Total | 50 | 100% | |||
| 7. | |||||
| S.NO. | Activities | Activity cost | Activity driver | Quantity | Cost/unit (?) |
| 1. | Processing orders | 15,03,840 | No. of orders | 6,300 | 238.70 |
| 2. | Scheduling orders | 12,53,200 | No. of work orders | 330 | 3,797.57 |
| 3. | Set-up machines | 17,54,480 | No. of set-ups | 330 | 5,316.60 |
| 4. | Inspection lots | 10,02,560 | No. of lots | 330 | 3,038.06 |
| 5. | Shipping part | 7,51,920 | No. of shipments | 6,300 | 119.35 |
| Activity Costs Calculation |
| PART | Selling price (?) | TCA cost (?) | TCA margin (?) | TCA margin% | True cost (?) | True cost margin (?) | True cost margin% | |
| Part "A" | 1,200 | 895 | 305 | 25.41% | 870.03 | 329.97 | 27.49% | |
| Part "B" | 850 | 616.31 | 233.69 | 27.50% | 636.26 | 213.74 | 25.14% | |
| Part "C" | 1,150 | 745.51 | 404.49 | 35.18% | 751.41 | 398.59 | 34.66% | D |