ob satisfaction is one of the major outcomes of an organization which means positive,
emotional and pleasurable response of employees towards their particular job or organization.
Job satisfaction increases the efficiency and productivity of the business organization.
When employees receive expected rewards and incentives from their job it helps to
satisfy them (Poudyal & Pradhan, 2018). For example, paying workers high salaries can enhance satisfaction and reduce turnover,
but it also may detract from bottom-line performance (Griffin & Moorhead, 2017). Therefore, job satisfaction is an essential dependent variable that companies always
expect to make positive by making favorable changes in the organization's motivational
factors for its employees with the view of achieving various organizational goals
like; reduction in the organization's cost of training employees, increment in organization's
productivity, reduction in workplace stress of employees, reduction in inter-personal,
intrapersonal and inter-group conflict in organization, etc. Companies provide various
motivational forces to their employees working in different managerial levels.
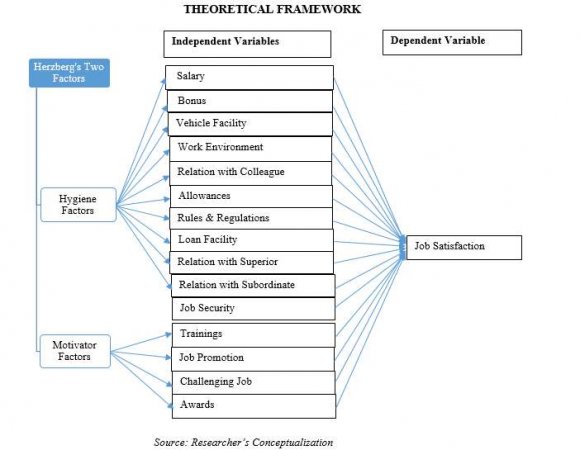
According to 'Herzberg's Two Factor Theory' of motivation, the job satisfaction of
employees is determined by mainly two factors. He named the factors as hygiene factors
and motivator factors. This study uses the hygiene (extrinsic) factors and motivator
(intrinsic) factors of Herzberg to determine the level of job satisfaction of employees
working in existing banks and insurance companies of Nepal. Intrinsic factors, such
as achievement, recognition, the work itself, responsibility, advancement and growth
seem to be related to job satisfaction (Aswathappa, 2017). On the other hand, when they are dissatisfied, they tended to extrinsic factors,
such as company policy and administration, supervision, work conditions, salary, status,
security, and interpersonal relations (Aswathappa, 2017). However, this research study has undertaken salary, bonus, vehicle facility, work
environment, relation with colleagues, allowances, rules and regulations, loan facility,
relation with superior, relation with subordinate and job security as hygiene factors
of job satisfaction, whereas training, job promotion, awards and challenging job are
considered as motivator factors of job satisfaction of employees working in bank and
insurance companies of Nepal.
In summary, Nepal has witnessed a noticeable growth of banking and financial institutions
after economic liberalization and intensified competition among the banks (Yukongdi & Shrestha, 2020). As a competitive tool, banks have restored to a strategy of attracting talented
human resources from rival firms by offering lucrative compensation packages, training,
and career development opportunities (Bista & Regmi, 2016). So, this research paper examines whether or not the hygiene factors and motivator
factors of Herzberg's Two Factor Theory significantly impact the job satisfaction
of human resources.
II. Literature Review Locke (1976) concluded that job satisfaction is a positive emotional feeling attributed to the
appraisal of one's job or job experiences. Benefit, as a significant consideration
in the reward and motivation system, conveys a message to employees about what the
organizations believe to be essential and worth encouraging (Lawller, 1986). Job satisfaction is associated with increased output, efficiency of the organization,
loyalty to the organization, and reduced absenteeism and earnings (Ellickson & Logsdon, 2001). Job satisfaction positively affects the ability, effort, and capability of the employees
(Wright & Davis, 2003). Pension and profit-sharing plans are positively associated with job satisfaction
(Bender & Heywood, 2006). Positive and favorable attitudes toward the job indicate job satisfaction similarly,
negative and unfavorable attitudes towards the job indicate job dissatisfaction (Amstrong, 2006). Armstrong (2006) classified job satisfaction has multi-dimensional facets consisting of attitude toward
salary, promotion, working experience, working environment, and nature of work.
Job satisfaction is the collection of feelings and beliefs that human resources have
about their current job (George & Jones, 2008). A satisfied worker tends to be less absent from their job, contributes to the company's
benefit, and would like to stay in the organization (Adhikari, 2009). An effective reward system with adequate performance recognition creates employee
job satisfaction and enhances favorable working conditions, which serve as crucial
motivators (Danish & Usman, 2010). At the time, the Imperial Bank of Kenya was experiencing low profitability due to
dissatisfied employees and high turnover, still after investing in some of the precious
resources like benefits, decision-making authority, training, and development, they
began to enjoy the benefits of such policies (Newman et al., 2011). Salary and remuneration is the most essential factor ranked by employees of commercial
banks (Gautam, 2011).Banks must demonstrate a satisfactory commitment to their employees through benefits,
decision-making authority over how to accomplish the goal, and the use of employees'
knowledge, skills, and competencies (Walia and Bajaj, 2012).
In previous years, factors such as a lack of physical stress on the job, a lack of
tangible and intangible compensation, a lack of supervision, and so on were widely
regarded as deterrents to job satisfaction (Iqbal et al., 2012). Keith (2013) explained the factors influencing job satisfaction depend upon the nature of the
work and working environment. An increase in the level of financial benefit, performance
appraisal system, promotional strategies, training, and development program improves
the overall satisfaction of human resources (Sharma et al., 2014). Dissatisfied employees, on the other hand, are unwilling to accept any pressure
for their work, in contrast satisfied employees are always willing to complete their
job, even if it is difficult to perform (Simes et al., 2019). As a competitive tool,
the banks have resorted to a policy of poaching talented human resources from the
competing banks by offering better incentives (Bista & Regmi, 2016). Employee job satisfaction has a significant impact as it leads to increased productivity
of the employees, a decreased employee turnover rate, and, consequently a profit margin
(Santis et al., 2018).
Based on the literature review, this study has been conducted to test the following
assumptions: H1: There is a statistically significant mean difference in the level
of job satisfaction due to the difference in level of hygiene factors.
H2: There is a statistically significant mean difference in the level of job satisfaction
due to the difference in the level of motivator factors. to process and analyze the
collected primary data. In IBM SPSS software, at first, the variables are coded with
specific code, and then after, as per the requirement of the research, to depict answers
of the research questions, to meet the stated objectives and to test the setup hypothesis,
the data are analyzed and evaluated with the help of statistical tool-i.e, independent
sample ttest. To meet the assumptions of an independent sample t-test at first, the
Likert scale data related to independent variables are categorized into two groupsi.e,
motivational and de-motivational. The data included in the Excellent, Good, and Average
options have been grouped as a motivational group, whereas the data related to the
remaining two options-i.e., Fair and Poor have been grouped as a de-motivational group.
The job satisfaction that arises from all motivational factors are also grouped into
one dependent variable-i.e, job satisfaction. To test the normality of job satisfaction,
the Shapiro Wilk test has been done for each case. Then after, an independent sample
t-test was done to test the stated alternative hypothesis. Cronbach's Alpha value
(?) has been calculated to measure the internal consistency of the questions that
were asked to respondents at the time of the survey. George and Mallery (2003) provide the following rules of thumb: "_ > .9 -Excellent,_ > .8 -Good, _ > .7 -Acceptable,
_ > .6 -Questionable, _ > .5 -Poor, and _ < .5 -Unacceptable".
2. Cronbach's Alpha
No. of Items 0.700 15
The above table signifies that, by considering all the 15 constructs related to independent
variables, the Cronbach's Alpha value (?) that the researcher has gotten is 0.7. Here,
Cronbach's Alpha value is equal to '0.7'. This means, the internal consistency among
the constructs related to independent variables is good, and the data that the researcher
has collected to identify the impact of motivational factors to job satisfaction can
be statistically trusted and accepted.
This research work has also met the core assumptions of independent sample t-tests
which are as follows:
i. As one dependent variable should be measured in ratio scale here, job satisfaction
has been measured in ratio scale.
ii. As independent variables should be measured in nominal scale here, each motivational
factor has been classified in to two separate groups. One is motivational factor,
and another is the demotivational factor. iii. To meet the assumption of independence,
one respondent of the survey has only responded to one group of independent variables
(all 15 motivational factors). iv. To meet the assumption of normal distribution,
the Shapiro Wilk test has been done. The p-value (sign.) of the job satisfaction is
greater than the alfa (?) value-i.e., 0.05 in each of the two groups of independent
variables. The above table shows us that, out of 200 respondents in the field survey,
191 respondents have been receiving a salary that motivates them to do their job,
whereas 9 respondents have been receiving a salary that demotivates them to do their
job. Here, the mean score of job dis-satisfaction (M=46.5556) of human resources which
have been receiving a salary at de-motivational level is higher than the mean score
of job satisfaction (M=40.4293) of human resources which have been receiving salary
at the motivational level. In the above table, F-test (Levene's test) has been done
to evaluate the equality of variance. It can be seen that the p-value is 0.322(which
is greater than 0.05). It indicates that the variances are significantly equal. Hence,
the case of "Equal Variances Assumed" has been considered. The values under the "t-test
for Equality of Means" has been examined. So, the p-value for the equal variances
t-test is p=0.006. Since this p-value is lesser than 0.05, it is concluded that there
is a statistically significant mean difference in the level of job satisfaction due
to the difference in the payment of salary.
3. IV. Result and Discussion
4. Salary
The above table shows us the p-value of the job satisfaction (p=0.435) is greater
than the alfa value (?=0.05) in motivational bonuses. Therefore, job satisfaction
is normally distributed within the sample size of human resources receiving motivational
bonuses. Similarly, the p-value of job satisfaction (p=0.501) is greater than the
alfa value (?=0.05) in de-motivational bonus. Therefore, the job satisfaction is normally
distributed within the sample size of human resources receiving de-motivational bonuses.
The above table shows us that, out of 200 respondents in the field survey, 167 respondents
have been receiving a bonus that motivates them to do their job, whereas 33 respondents
have been receiving a bonus that demotivate them to do their job. Here, the mean score
of job dis-satisfaction (M=44.5455) of human resources which been receiving a bonus
at the de-motivational level is higher than the mean score of job satisfaction (M=39.9461)
of human resources which have been receiving a bonus at the motivational level. In
the above table, F-test (Levene's test) has been done to evaluate the equality of
variance. It can be seen that the p-value is 0.665 (which is greater than 0.05). It
indicates that the variances are significantly equal. Hence, the case of "Equal Variances
Assumed" has been considered. The values under the "t-test for Equality of Means"
has been examined. So, the p-value for the equal variances t-test is p=0.000. Since
this p-value is lesser than 0.05, it is concluded that there is a statistically significant
mean difference in the level of job satisfaction due to the difference in the payment
of bonuses. The above table shows us that, out of 200 respondents in the field survey,
134 respondents have been receiving vehicle facility that motivates them to do their
job, whereas 66 respondents have been receiving vehicle facility that demotivates
them to do their job. Here, the mean score of job dis-satisfaction (M=44.1364) of
human resources which have been receiving vehicle facility at the de-motivational
level is higher than the mean score of job satisfaction (M=39.0149) of human resources
which have been receiving vehicle facility at the motivational level.
5. Bonus
In the above table, F-test (Levene's test) has been done to evaluate the equality
of variance. It can be seen that the p-value is 0.978(which is greater than 0.05).
It indicates that the variances are significantly equal. Hence, the case of "Equal
Variances Assumed" has been considered. The values under the "t-test for Equality
of Means" has been examined. So, the p-value for the equal variances t-test is p=0.000.
Since this p-value is lesser than 0.05, it is concluded that there is a statistically
significant mean difference in the level of job satisfaction due to the difference
in providing vehicle facilities to human resources.
The above table shows us the p-value of the job satisfaction (p=0.216) is greater
than the alfa value (?=0.05) in motivational training. Therefore, the job satisfaction
is normally distributed within the sample size of human resources receiving motivational
training. Similarly, the p-value of the job satisfaction (p=0.250) is greater than
the alfa value (?=0.05) in de-motivational trainings. Therefore, job satisfaction
is normally distributed within the sample size of human resources receiving de-motivational
training.
The above table shows us that, out of 200 respondents in the field survey, 158 respondents
have been receiving proper training that motivates them to do their job, whereas 42
respondents have not been receiving appropriate training. As a result, that demotivates
them to do their job. Here, the mean score of job dis-satisfaction (M=44.7143) of
human resources who have not been receiving proper training at the motivational level
is higher than the mean score of job satisfaction (M=39.6392) of human resources which
have been receiving appropriate training at the motivational level. In the above table,
F-test (Levene's test) has been done to evaluate the equality of variance. It can
be seen that the p-value is 0.339(which is greater than 0.05). It indicates that the
variances are significantly equal. Hence, the case of "Equal Variances Assumed" has
been considered. The values under the "t-test for Equality of Means" has been examined.
So, the p-value for the equal variances t-test is p=0.000. Since this p-value is lesser
than 0.05, it is concluded that there is a statistically significant mean difference
in the level of job satisfaction due to the difference in providing training to the
human resources.
The above table shows us the p-value of job satisfaction (p=0.725) is greater than
the alfa value (?=0.05) in motivational job promotion. Therefore, job satisfaction
is normally distributed within the sample size of human resources receiving motivational
job promotions. Similarly, the p-value of the job satisfaction (p=0.059) is greater
than the alfa value (?=0.05) in de-motivational job promotion. Therefore, the job
satisfaction is normally distributed within the sample size of human resources receiving
de-motivational job promotion.
The above table shows us that, out of 200 respondents in the field survey, 135 respondents
have been receiving job promotion that motivates them to do their job, whereas 65
respondents have not been receiving job promotion. As a result, that demotivates them
to do their job. Here, the mean score of job dis-satisfaction (M=44.5846) of human
resources who have not been receiving job promotion is higher than the mean score
of job satisfaction (M=38.8370) of human resources who have been receiving job promotion.
In the above table, F-test (Levene's test) has been done to evaluate the equality
of variance. It can be seen that the p-value is 0.522(which is greater than 0.05).
It indicates that the variances are significantly equal. Hence, the case of "Equal
Variances Assumed" has been considered. The values under the "t-test for Equality
of Means" has been examined. So, the p-value for the equal variances t-test is p=0.000.
Since this p-value is lesser than 0.05, it is concluded that there is a statistically
significant mean difference in the level of job satisfaction due to the difference
in providing job promotion to human resources. The above table shows us the p-value
of the job satisfaction (p=0.668) is greater than the alfa value (?=0.05) in the motivational
work environment. Therefore, job satisfaction is normally distributed within the sample
size of human resources enjoying a motivational work environment. Similarly, the p-value
of job satisfaction (p=0.697) is greater than the alfa value (?=0.05) in de-motivational
work environment. Therefore, job satisfaction is normally distributed within the sample
size of human resources getting de-motivational work environment.
The above table shows us that, out of 200 respondents in the field survey, 172 respondents
have been enjoying the work environment that motivates them to do their job, whereas
28 respondents have been receiving the work environment that demotivates them to do
their job. Here, the mean score of job dis-satisfaction (M=45.6786) of human resources
who have been receiving de-motivational work environment is higher than the mean score
of job satisfaction (M=39.8953) of human resources who have been enjoying motivational
work environment.
In the above table, F-test (Levene's test) has been done to evaluate the equality
of variance. It can be seen that the p-value is 0.016(which is lesser than 0.05).
It indicates that the variances are significantly unequal. Hence, the case of "Equal
Variances Not Assumed" has been considered. The values under the "t-test for Equality
of Means" has been examined. So, the p-value for the unequal variances t-test is p=0.000.
Since this p-value is lesser than 0.05, it is concluded that there is a statistically
significant mean difference in the level of job satisfaction due to the difference
in providing a work environment to the human resources.
The above table shows us the p-value of the job satisfaction (p=0.587) is greater
than the alfa value (?=0.05) in motivational relation with colleagues. Therefore,
job satisfaction is normally distributed within the sample size of human resources
who have motivational relations with their colleagues. Similarly, the p-value of job
satisfaction (p=0.407) is greater than the alfa value (?=0.05) in de-motivational
relation with colleagues. Therefore, job satisfaction is normally distributed with
in the sample size of human resources who have de-motivational relationswith their
colleagues. The above table shows us out of 200 respondents in the field survey, 193
respondents have been enjoying the relationship with colleagues that motivates them
to do their job, whereas 7 respondents have been placed in the relationship with colleagues
that demotivates them to do their job. Here, the mean score of job dis-satisfaction
(M=42.7143) of human resources who have been placed in a relation with colleagues
that de-motivates them to do their job is higher than the mean score of job satisfaction
(M=40.6321) of human resources who have motivational relation with their colleagues.
In the above table, F-test (Levene's test) has been done to evaluate the equality
of variance. It can be seen that the p-value is 0.537(which is greater than 0.05).
It indicates that the variances are significantly equal. Hence, the case of "Equal
Variances Assumed" has been considered. The values under the "t-test for Equality
of Means" has been examined. So, the p-value for the equal variances t-test is p=0.410.
Since this p-value is greater than 0.05, it is concluded that there is no statistically
significant mean difference in the level of job satisfaction due to the difference
in providing relations with colleagues.
The above table shows us the p-value of the job satisfaction (p=0.153) is greater
than the alfa value (?=0.05) in motivational allowances. Therefore, job satisfaction
is normally distributed within the sample size of human resources who have been receiving
allowances at the motivational level. Similarly, p-value of job satisfaction (p=0.088)
is greater than the alfa value (?=0.05) in de-motivational allowances. Therefore,
the job satisfaction is normally distributed within the sample size of human resources
who have been receiving allowances at demotivational level.
The above table shows us that, out of 200 respondents in the field survey, 180 respondents
have been receiving allowances that motivate them to do their job, whereas 7 respondents
do not have been receiving allowances that motivates them to do their job. Here, the
mean score of job satisfaction (M=40.7222) of human resources who have been receiving
allowances that motivates them to do their job is slightly higher than the mean score
of job dis-satisfaction (M=40.5500) of human resources who do not have been receiving
allowances that motivates them to do their job. In the above table, F-test (Levene's
test) has been done to evaluate the equality of variance. It can be seen that the
p-value is 0.737(which is greater than 0.05). It indicates that the variances are
significantly equal. Hence, the case of "Equal Variances Assumed" has been considered.
The values under the "t-test for Equality of Means" has been examined. So, the p-value
for the equal variances t-test is p=0.912. Since this p-value is greater than 0.05,
it is concluded that there is no statistically significant mean difference in the
level of job satisfaction due to the difference in providing allowances to human resources.
The above table shows us the p-value of the job satisfaction (p=0.283) is greater
than the alfa value (?=0.05) in motivational rules and regulations. Therefore, job
satisfaction is normally distributed within the sample size of human resources who
say that organizational rules and regulations motivate them to do their job. Similarly,
the p-value of the job satisfaction (p=0.894) is greater than the alfa value (?=0.05)
in de-motivational rules and regulations. Therefore, job satisfaction is normally
distributed within the sample size of human resources who say that organizational
rules and regulations demotivate them to do their job. The above table shows us that,
out of 200 respondents in the field survey, 170 respondents say that organizational
rules and regulations have motivated them to do their jobs, whereas 30 respondents
say that organizational rules and regulations have demotivated them to do their job.
Here, the mean score of job dissatisfaction (M=46.0000) of human resources who say
that organizational rules and regulations have demotivated them to do their job is
higher than the mean score of job satisfaction (M=39.7706) of human resources who
say that organizational rules and regulations have motivated them to do their job.
The above table shows us that p-value of the job satisfaction (p=0.205) is greater
than the alfa value (?=0.05) in the motivational loan facility. Therefore, the job
satisfaction is normally distributed within the sample size of human resources who
have been receiving loan facility that motivates them to do their job. Similarly,
the p-value of the job satisfaction (p=0.708) is greater than the alfa value (?=0.05)
in the de-motivational loan facility. Therefore, job satisfaction is normally distributed
within the sample size of human resources who say that the loan facility they have
been receiving demotivates them to do their job. The above table shows us that, out
of 200 respondents in the field survey, 177 respondents say that loan facility has
motivated them to do their job, whereas 23 respondents say that loan facility has
demotivated them to do their job. Here, the mean score of job dissatisfaction (M=48.1739)
of human resources who say that available loan facility has demotivated them to do
their job is higher than the mean score of job satisfaction (M=39.7345) of human resources
who say that loan facility has motivated them to do their job. In the above table,
F-test (Levene's test) has been done to evaluate the equality of variance. It can
be seen that the p-value is 0.170(which is greater than 0.05). It indicates that the
variances are significantly equal. Hence, the case of "Equal Variances Assumed" has
been considered. The values under the "t-test for Equality of Means" has been examined.
So, the p-value for the equal variances t-test is p=0.000. Since this p-value is lesser
than 0.05, it is concluded that there is a statistically significant mean difference
in the level of job satisfaction due to the difference in providing loan facilities.
The above table shows us the p-value of the job satisfaction (p=0.329) is greater
than the alfa value (?=0.05) in motivational relation with superior. Therefore, job
satisfaction is normally distributed within the sample size of human resources who
say that their relation with superiors has motivated them to do their job. Similarly,
the p-value of the job satisfaction (p=0.279) is greater than the alfa value (?=0.05)
in de-motivational relation with The above table shows us out of 200 respondents
in the field survey, 188 respondents say that their relationship with superior has
motivated them to do their job whereas 12 respondents say that relationship with their
superior has demotivated them to do their job. Here, the mean score of job dissatisfaction
(M=47.0833) of human resources who say that relationship with their superior has demotivated
them to do their job is higher than the mean score of job satisfaction (M=40.2979)
of human resources who say that relation with superior has motivated them to do their
job. In the above table, F-test (Levene's test) has been done to evaluate the equality
of variance. It can be seen that the p-value is 0.300(which is greater than 0.05).
It indicates that the variances are significantly equal. Hence, the case of "Equal
Variances Assumed" has been considered. The values under the "t-test for Equality
of Means" has been examined. So, the p-value for the equal variances t-test is p=0.000.
Since this p-value is lesser than 0.05, it is concluded that there is a statistically
significant mean difference in the level of job satisfaction due to the difference
in maintaining the relation between superior and subordinate. The above table shows
us the p-value of job satisfaction (p=0.401) is greater than the alfa value (?=0.05)
in motivational awards. Therefore, the job satisfaction is normally distributed within
the sample size of human resources who say that awards have motivated them to do their
job. Similarly, the p-value of the job satisfaction (p=0.260) is greater than the
alfa value (?=0.05) in de-motivational awards. Therefore, job satisfaction is normally
distributed within the sample size of human resources who say that awards have demotivated
them to do their job. The above table shows us out of 200 respondents in the field
survey, 139 respondents say that awards have motivated them to do their job, whereas
61 respondents believe that awards have demotivated them to do their job.
Here, the mean score of job dissatisfaction (M=45.0492) of human resources who say
that awards have demotivated them to do their job is higher than the mean score of
job satisfaction (M=38.7986) of human resources who say that awards have motivated
them to do their job. In the above table, F-test (Levene's test) has been done to
evaluate the equality of variance. It can be seen that the p-value is 0.816 (which
is greater than 0.05). It indicates that the variances are significantly equal. Hence,
the case of "Equal Variances Assumed" has been considered. The values under the "t-test
for Equality of Means" has been examined. So, the p-value for the equal variances
t-test is p=0.000. Since this p-value is lesser than 0.05, it is concluded that there
is a statistically significant mean difference in the level of job satisfaction due
to the difference in providing awards to employees as recognition of their work. The
above table shows us that p-value of the job satisfaction (p=0.531) is greater than
the alfa value (?=0.05) in motivational challenging jobs. Therefore, job satisfaction
is normally distributed within the sample size of human resources who say that delegation
of challenging job has motivated them to do their job. Similarly, the pvalue of job
satisfaction (p=0.782) is greater than the alfa value (?=0.05) in a de-motivational
challenging job. Therefore, job satisfaction is normally distributed within the sample
size of human resources who say that the delegation of challenging job has demotivated
them to do their job. The above table shows us out of 200 respondents in the field
survey, 181 respondents say that delegation of challenging job has motivated them
to do their job, whereas 19 respondents say that delegation of challenging job has
demotivated them to do their job. Here, the mean score of job dissatisfaction (M=46.6316)
of human resources who say that challenging job has demotivated them to do their job
is higher than the mean score of job satisfaction (M=40.0829) of human resources who
say that challenging job has motivated them to do their job The above table shows
us the p-value of job satisfaction (p=0.074) is greater than the alfa value (?=0.05)
in motivational relation with subordinate. Therefore, the job satisfaction is normally
distributed within the sample size of human resources who say that their relation
with subordinate has motivated them to do their job. Similarly, the pvalue of the
job satisfaction (p=0.910) is greater than the alfa value (?=0.05) in the de-motivational
relation with subordinate. Therefore, the job satisfaction is normally distributed
within the sample size of human resources who say that their relation with subordinate
has demotivated them to do their job. The above table shows us out of 200 respondents
in the field survey, 188 respondents say that their relation with subordinate has
motivated them to do their jobs whereas 12 respondents believe that their relation
with subordinate has demotivated them to do their job. Here, the mean score of job
dissatisfaction (M=47.5000) of human resources who say that their relation with subordinate
has demotivated them to do their job is higher than the mean score of job satisfaction
(M=40.2713) of human resources who say that their relation with subordinate has motivated
them to do their jobs. In the above table, F-test (Levene's test) has been done to
evaluate the equality of variance. It can be seen that the p-value is 0.335(which
is greater than 0.05). It indicates that the variances are significantly equal. Hence,
the case of "Equal Variances Assumed" has been considered. The values under the "t-test
for Equality of Means" has been examined. So, the p-value for the equal variances
t-test is p=0.000. Since this p-value is lesser than 0.05, it is concluded that there
is a statistically significant mean difference in the level of job satisfaction due
to the difference in relation with subordinate. The above table shows us the p-value
of the job satisfaction (p=0.583) is greater than the alfa value (?=0.05) in motivational
job security. Therefore, the job satisfaction is normally distributed with in the
sample size of human resources who believe that job security has motivated them to
do their job. Similarly, p-value of the job satisfaction (p=0.911) is greater than
the alfa value (?=0.05) in de-motivational job security. Therefore, the job satisfaction
is normally distributed with in the sample size of human resources who believe that
job security has demotivated them to do their job. The above table shows us out of
200 respondents of field survey, 164 respondents say that job security has motivated
them to do their job, whereas 36 respondents say that job security has demotivated
them to do their job.
6. Global
Here, the mean score of job dissatisfaction (M=44.0278) of human resources who say
that job security has demotivated them to do their job is higher than the mean score
of job satisfaction (M=39.9756) of human resources who say that job security has motivated
them to do their job. In the above table, F-test (Levene's test) has been done to
evaluate the equality of variance. It can be seen that the p-value is 0.476(which
is greater than 0.05). It indicates that the variances are significantly equal. Hence,
the case of "Equal Variances Assumed" has been considered. The values under the "t-test
for Equality of Means" has been examined. So, the p-value for the equal variances
t-test is p=0.001. Since this pvalue is lesser than 0.05, it is concluded that there
is a statistically significant mean difference in the level of job satisfaction due
to the difference in providing job security to employees.
7. V. Conclusion
The result of each independent sample t-test concluded that except for the two hygiene
factors-i.e, relation with colleagues and allowance, all the motivational factors
significantly do affect on job satisfaction of human resource working in bank and
insurance companies of Nepal. This meansan increase or decrease in the level of the
remaining 13 factors of motivation significantly do change the level of job satisfaction
of human resource working in bank and insurance companies of Nepal. Oppositely, an
increase or decrease in the level of 2 motivational factors do not significantly change
the level of job satisfaction of human resource working in bank and insurance companies
of Nepal. The conclusion of the research work partially supports the conclusion of
Herzberg's theory of motivation. The result of the independent sample t-test has concluded
that there is a significant mean difference in the level of job satisfaction due to
changes in the level of 11 hygiene factors-i.e, salary, bonus, vehicle facility, work
environment, relation with colleague, allowances, rules & regulations, loan facility,
relation with superior, relation with subordinate and job security. This means when
all these hygiene factors increase or decrease, then job satisfaction also increase
or decrease but according to Herzberg, when these hygiene factors get increase then
the level of job satisfaction does not increase. Whereas other conclusions of Herzberg's
theory, like; the absence or decrease in the level of hygiene factors creates dissatisfaction
among employees, an increase in the level of motivator factors increase the level
of job satisfaction, and a decrease the level of motivator factors decrease the level
of job satisfaction has been matched with the conclusion of this research work.
The results of the independent sample t-test suggest that there is no significant
mean difference in the level of job satisfaction due to changes in the level of allowance
and relation with colleagues. This conclusion indicates that the bank and insurance
companies of Nepal should not invest their vast amount of finance, time, and effort
to increase the amount of allowance and assist in maintaining reasonable and friendlier
relations with colleagues of the human resource because at the end that will not play
vital role to increase the level of job satisfaction rather than, bank and insurance
companies can invest their time, effort and finance in the remaining 13 factors of
motivation to increase the level of job satisfaction of human resource.
Figure 1. Figure 1 :1
Figure 2. Table 3 :3
Year 2023
Volume XXIII Issue V Version I
( ) A
Global Journal of Management and Business Research
The above table shows us thep-value of the job satisfaction (p=0.581) is greater than
the alfa value
(?=0.05) in motivational salary. Therefore, job satisfaction is normally distributed
within the sample size of human
resources receiving motivational salary. Similarly, the p-value of job satisfaction
(p=0.260) is greater than the alfa
value (?=0.05) in de-motivational salary. Therefore, job satisfaction is normally
distributed with in the sample size of
human resources receiving the de-motivational salary.
Salary
N
Mean
Std. Deviation
Job Satisfaction
Motivational Salary De-motivational Salary
191 9
40.4293 46.5556
6.49404 5.15051
Figure 4. Table 2 :2
Shapiro-Wilk
Statistic
df
Sig.
Figure 5. Table 4 :4
Figure 6. Table 5 :5
Figure 7. Table 6 :6
Figure 8. Table 7 :7
An Empirical Study on Factors Influencing Job Satisfaction of Human Resource in Banks
and Insurance
Companies of Nepal
15
Figure 9. Table 10 :10
N
Mean
Std. Deviation
Note:
The above table shows us the p-value of job satisfaction (p=0.110) is greater than
the alfa value (?=0.05) in the motivational vehicle facility. Therefore, job satisfaction
is normally distributed within the sample size of human resources receiving motivational
salaries. Similarly, the p-value of the job satisfaction (p=0.372) is greater than
the
Figure 10. Table 11 :11
Year 2023
Volume XXIII Issue V Version I
( ) A
Global Journal of Management and Business Research
A comparative study of sleep habits among medical and non-medical students in Saifai.
A Et Sharma
. Itawah. International journal community medical public healthSept, 2014. 5 p. .
The impact of employee perceptions of training on organizational commitment and turnover
intentions: A study of multinationals in the Chinese service sector.
A Newman
, R Thanacoody
, W Hui
. The International Journal of Human Resource Management2011. 22 (8) p. .
Does cultural capital matter for individual job performance? A large-scale survey
of the impact of cultural, social and psychological capital on individual performance
in Brazil.
A S Santis
, M T R Neto
, E Verwaal
. International Journal of Productivity and Performance Management2018. 67 (8) p. .
Impact of human resource management (HRM) practices on employee retention.
Bajaj Walia
. International journal of research in IT & management2012. 2 (2) p. .
Job Satisfaction in the Public Sector: The Role of the Work Environment,
B E Wright
, B S Davis
. 2003. American Review of Public Administration. 33 p. .
D George
, P Mallery
. SPSS for Windows step by step: A simple guide and reference. 11.0 update,
(Boston )
2003. Allyn & Bacon.
(th ed.)
An assessment on job satisfaction of academic employees: a survey on Ethiopian private
institutions of higher learning.
D Keith
. International Journal of Research in Commerce and Management2013. 4 (12) p. .
Changing perspectives of managing human resources in Nepal.
D K Gautam
. Proceedings of Nepalese Academy of management,
(Nepalese Academy of management)
2011. 1 p. .
D R Adhikari
. Organizational Behaviour,
(Kathmandu )
2009. Buddha Academic.
(rd ed.)
Handbook of Industrial and Organizational Psychology,
E A Locke
.
Dunnette, M. D. (ed.)
1976. Rand McNally, Chicago, IL. p. .
(The nature and causes of job satisfaction)
High-Involvement arrangement: Participative strategies for improving organizational
performance.
E Lawller
. International journal of Bank Marketing1986. 24 (1) p. .
Understanding and managing organizational behavior,
J M George
, G R Jones
. 2008. New Jersey: Pearson/Prentice Hall.
Job Satisfaction of the Highly Educated: The Role of Gender, Academic Tenure, and
Earnings.
K A Bender
, J S Heywood
. Scottish journal of Political Economy2006. 53 (2) p. .
K Aswathappa
. Organizational Behaviour,
2017. Himalaya Publishing House Pvt. Ltd.
(th ed.)
A Handbook of Human Resource Management Practice,
M Armstrong
. 2006. Kogan Page Publishers. p. 19.
Determinants of Job Satisfaction of Municipal Government Employees.
M C Eilickson
, K Logsdon
. State and Local Government Review2001. 33 (3) p. .
The impact of person job fit on job satisfaction and its subsequent impact on employees
performance.
M T Iqbal
, W Latif
, W Naseer
. Mediterranean Journal of Social Sciences2012. 3 (2) p. .
Job Satisfaction among Employees of Commercial Banks in Nepal.
P Bista
, R Regmi
. Proceedings of the Australia-Middle East Conference on Business and Social Sciences,
(the Australia-Middle East Conference on Business and Social Sciences)
2016. p. .
Impact of reward and recognition on job satisfaction and motivation: An empirical
study from Pakistan.
R Q Danish
, A Usman
. International Journal of Business and Management2010. 5 (2) p. .
Organizational Behavior: Managing People and Organizations.
R W Griffin
, G Moorhead
. South-Western, a part of Cengage Learning,
2017.
(th ed.)
S R Poudyal
, G M Pradhan
. Organizational Behaviour,
2018. Kriti Books Publishers and Distribution Pvt. Ltd.
(nd ed.)
The influence of affective commitment, job satisfaction, and job stress on turnover
intention: A study of Nepalese Bank employees.
V Yukongdi
, P Shrestha
. Review of Integrative Business and Economics Research2020. 9 (1) p. .