1. I. Introduction
overnment is responsible of any economic state; employment, law, unemployment, price stability, salaries and economic rise. They are the most important goals of any government.
Government rely on their futuristic sight in planning to reach their goals. In order to realize these goals, they have to use taxes in different forms and initiate a good public spending policy. So, our choice comes on that economic and financial policies and their role in the economic sphere, of any country. This work is an attempt about all these elements, since we lack many points about this topic; we decided to do the research.
2. II. Studies Obstacles
According to « John Maynard Keynes » (John Maynard KEYNES,1936), the financial thought rely on public spending and he considered it as an important Financial policy in order to reach a kind of economic development. Keynes principle was that "supply create the offer" that's to say public spending is a public supply that create parallel response with the offer, consequently an increase in national income.
In 2001, Algeria adopted this public spending in 3 forms, within different periods. In 2001 -2004, the weakening economic program, the complementary to launch the economy between 2009 -2014.
The main objective of their programs is to ameliorate the financial position, due to the crises of oil prices within the last years.
Algeria has adopted these policies to reach the economic stability of the country.
In this study we attempt to focus on public spending and the possible changes in imports. This is to show how to relive economic disturbances so as to create economic stability. In our study the following questions were raised:
-In what way can the change in public spending influence the imports in Algeria?
-What is the relationship between public spending and the imports in Algeria between the period 1990 -2012.
3. III. Public Spending
Public spending as an important tool in the political policy has witnessed many phases, theorical and practical answers. In the classical period, governments restrained public spending to a low level and restricted the role of government in spending. According to them, this latter is a waste and unproductive, however within the economic development changes permit to reinforced public spending since it's an important element in the social and economic balance. This is due to the world economic crisis witnessed in 2008 which increased the spending in general (Bernier wasmone, 1989).
A.P. Lerner abolished the classical thoughts about spending, when he created functional finance and encourages the policy of any country (Ahmed abedda mahmoud, 1971). -In the modern financial thought, both (Myrdal and Lindale) (Two Swedish known economists)
considered that public spending is so essential in order to avoid taxes imposed which emerged numerous problems .This phenomena was seen in the nineteenth century.
The financial policy cooperate with the general spending, this policy is applied in hard moments. Like crisis or unemployment where it's necessary to raise the averages of spending and reduce taxes of consumption and also taxes an investments. In case of inflation, the
The Impact of Public Spending on Imports in Algeria. Econometric Study between the Period (1990 -2012)"
financial policy is required to decrease spending by increasing the averages of taxes to allow a decrease in consumption and to raise the average of benefits in order to decrease the spending on investment. So, we can define public spending as follow:
-Public spending is all the sums of money spent by a person to realize a general need (al-housin khalef, 2008).
It is first, a sum of money, second this sum is released by a general power, third it is designed to reach a general need.
4. IV. The Orientation of Imports in Algeria
The economy of Algeria rely mostly on the import of the raw material, semi-industrial and industrial product. There is a close link between public spending and the imports. The source of Algerian spending comes from taxes and oil. This is the most important source since 90% of the balances revenues are from oil.
The international trade of Algeria is the same compared with most Arab countries, and developing countries because it's attached with the industrial countries and International markets, especially Europe in matters of export and imports.
The European community is the most important market for Algeria. The average imports from this market between 2001 -2012 had reached 54%, and 61.36% of the exports. As a result Algeria has great commercial exchanges within European countries.
The position of imports in Algeria is similar to the export, since the European countries are the most essential partners for Algeria.
5. V. The Causality Relationship between
The Public Spending and Import in Algeria
Algeria has relied on the « John Maynard Keynes » average to achieve the economic growth because of lack of private investment inside the country or outside it, and the reed to prepare one's national economy to start a new phase by relying on a strategy that aims at reinforcing underground structure (construction) and form human capital through education, and improve services in general.
This resulted in important public spending which contributed to increase in the size of demand and therefore the use of import of mainly industrialized products due to the lack of production (Boudakhdakh During the previews conditions, that's to say, huge dispenses by the government and the absence of an industrial basis capable to absorb these dispenses, the size of import rose and this helped in energizing (improving) the economy of other exporting countries.
Besides, Algeria hasn't benefited from external demand on its local products outside fuel sector.
6. VI. Designation of a Sample used in Study
Empirical economic literature includes a lot of studied which deals with the public spending DEP and the import IMP and we notice that these studies conclude in variable results.
In addition, Algeria aims at applying (implementing) a contributory and complementary analysis (Co integration analysis) and a sample of between public spending and the import. But before doing studying this relationship we have to anal use the time sequences to be sure of its stability (sedentation) through time and designate its complementary degree.
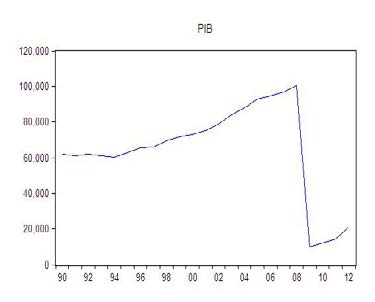
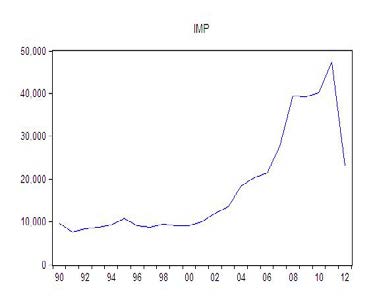
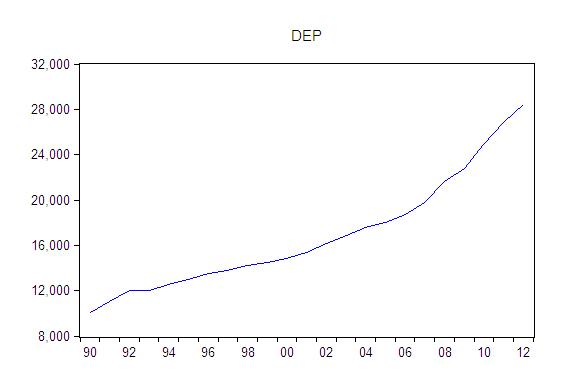
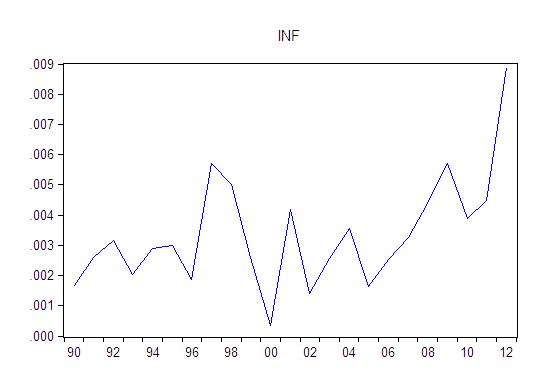
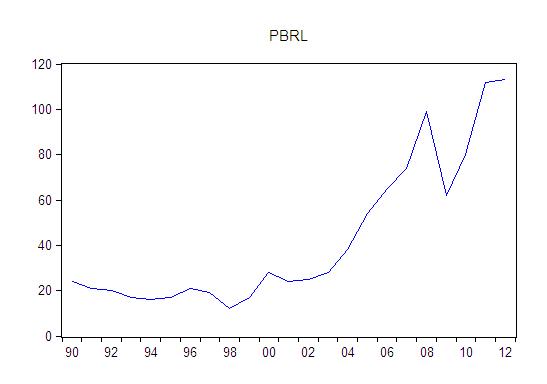
In this study, we shall construct a standard sample to know the importance of the public spending on the imports between (1990 -2012), using a new classical sample of development which constitutes variability's and define IMP as a variety which represents the imports supposing it is (function) in both the PIB and inflation INF, the price of the benefit (PBRL) and the public spending DEP as interpreting variability's:
The sample takes the mathematical general form. We could have the statistics of the different variables which constitute the international from a basis of information about the indicators of the international sector of statistics and the ministry of finance. The model becomes the following mathematical mode.
?"? : represents the spontaneous mistake limit of the equation (error term) and which supposes that its values are distributed in a natural way and with an average equal to zero and a stable differentiation.
These hypotheses are necessary for obtaining impartial potentials characterized by competence to each of the teachers of the modal Through that type of analyses we are going to estimate the modal of the study as follows:
t t t t t t LnDEP LnPBRL LnINF LnPIB LnIMP ? ? ? ? ? ? + + + + + = . . . 4 3 2 17. ???.. (2)
A variants logarithm was used in the modal become a doubled logarithm (Double-log regression modal), so that we avoid probable metric problems.
Moreover, the double logarithm modal potentials express flexibility of all variants in regard to the economic growth, the variants flexibility in regard with the economic growth becomes
4 3 2 1 , , , ? ? ? ? successively.To prove that, admitting that the equation relation in the modal be: A variants logarithm was used in the modal become a doubled logarithm (Double-log regression modal), so that we avoid probable metric problems.
Moreover, the double logarithm modal potentials express flexibility of all variants in regard to the economic growth, the variants flexibility in regard with the economic growth becomes To prove that, admitting that the equation relation in the modal be:
8. VII. Results of the Study of the Impact of Public Spending on Imports in Algeria
Annual data (1990 -2012) of the study variants were represented with (IMP?PIB ?INF? PBRL ?DEP ), have been used to explain the effect of the public spending on the import activity in Algeria, throughout evaluating the modal of the study: The test (ADF) is one of quantitative tests in this study so as to detect the variations stability and static or the chronological series whereas the test (DF) which is a simple test has been avoided because it doesn't correspond to (arriver) or ignores the auto-correlation in the uncertain error thus the sizes (greatnesses) of least squares don't satisfy the decline equation of the efficient estimates.
t9. i. ADF (Augmented Dickey-Fuller) test
The ADF test is given by the following equation as fellow:
t m t m i i t t U Y Y T A A Y + + + + = ? ? = ? ? 1 1 2 1 ? ?By presenting the datum ( pieces of data ) of the test of the root unity ( test ADF) which are given is table nº 2, it clearly appears that all the variations used in this estimate contain (insert ) the root unity, however we have to accept that the hypothesis of the unity root is useless for all the variations at the abstract level 5 % .
That is to say that they are not stable in the general level in the case where it is categorical and without general direction ( Intercept ) and also is the case of its presence category ( Trend and Intercept ) or the in existence and the general chronological direction Regarding that the temporal chains of the model variables are integral from the first class, it was quite important to test the presence of a long-term balance between them, despite of the existence of a disruption in the short-term. According to the testing of the common integration between the variables used in the method (Johansen, 1988) and (Johansen and Juselius, 1990), which consists of two and more variable and considered as the best one in case of two variable because it allows the mutual effect or the feedback effect among variables being studied and not existing in the method (Engle-Granger) (Khaled ben ben abdellah el-kadire, 2005).
Johansen and Juselius method depends on testing the number of the relation of common integration in the VAR system vector autoregressive ( VAR ) wish represents the relation of the long-term of variables in the equations system with consideration that all variables are internal in the modal.
The test has been held with (J.J) method with rupture and temporal direction in the integration equation and VAR test which is shown in table N° 03. The test and the great individual value test in the table above show the regression of the null hypothesis saying (r = 0) that there's no common integration between variables in the significance level 5%, where the calculated value of the trace test (? trace) estimated (90.44) greater than the two critical value (77.81) and (69.71) in 1% and 5% , successively, while the following value estimated by (57.00) is less than the critical value of (58.68) and (47.85). This is the test of the greatest possibility which show the non-regression of the null hypothesis saying the existence of a unique vector at most of the common integration. Furthermore, the maximal Eigen statistic (? max) has given the same results of the test. In consequence to, it's obvious that (IMP) representing the importation in Algeria is integral to a common integration with the public spending (DEP), the Gross domestic product (PIB), the inflation level (INF) and the oil price (PBRL).
These results mean that there's a stagnant linear continuation between (IMP) and the variables (DEP,PBRL,INF,PIB) despite of the fact that these variables are not stagnant. Moreover, these finding certifies that, finally, there's a long term balanceable relation between these variables which means that they are not far from each other where they go similarly.
As we can express the equation of the common integration as follows: It is evident from the estimations of the Cointegration vector in the above model that flexibility of the public spending on the importations in a long-term is equal to 0.0062%, which mean that the increase of equation with 10% leads to an increase in government with an increase rate of 6.2%, with a positive sign which goes perfectly with the theory, there's a direct relation of a direct investment of a long term with the importation.
tHowever, the rest of variables came with a negative indication which means that it has a negative effect on importation on the long-term, and that is opposite to the economic theory.
The finding have also shown that the coefficients of the common integration vector, which describes the long-term relation, are significant because the value Log Linklihood is equal to (514.8499).
10. c) Estimating vector error correction model
After testing the variables with unity root test, that certified the stability of the temporal chains after taking the first differences to it, and also testing the common integration, which proves existence of a common integration, another step comes up which consists of designing a VAR in a form of first difference to the variables ([VECM] vector error Correction Model to estimate the adaptation speed i.e. adaptation of any disruption in the short-term to a long-term balance between the importations and the study variables), and adding a slow time-gap to error correction term. This is implemented by estimating the following model after adding an individual correlation as follows:
t t j t k j j j t k j j j t k j j j t k j j j t k j j t Ec LnDEP LnPBRL LnINF LnPIB LnIMP LnIMP ? ? ? ? ? ? ? ? + + ? + ? + ? + ? + ? + = ? ? ? = ? = ? = ? = ? = ? ? ? ? ? 1 1 1 1 1 1Where the parameters ?, ?, ?, ?, ?, ? in the equation show that they are parameters of importation functions variables in the short-term, and ? denotes error correction coefficient Ec t-1 which include the test of the long-term. In addition to, it measures the disruption adaption fast in the short-term to the long-term balance,
11. Global Journal of Management and Business Research
Volume XV Issue II Version I Year ( )
C 2015where the short-term dynamic differs of the long-term balance, and the slowing following variables are added to be sure that t ? (the rest) is stable or from the (White Noise) ?17 type.
The finding in table (04) show that the estimated adaptation coefficients, which are implemented to test the extension of the effect power of the integrated variables in the equation on the importations, where it comprises the weighs through which the common integration vector integrate the mechanism of the shortterm, and it measures the response fast of the shortterm disequilibrium which occurs in the whole system.
? -White Noise: The white noise is a stationary time series or a stationary random process with zero autocorrelation. In other words, in white noise N (t) any pair of values N(t 1 ) and N(t 2 ) taken at different moments t 1 and t 2 of time are not correlated -i.e. the correlation coefficient r(N(t 1 ),N(t 2 )) is equal to null. The table (04) shows that the variables shift has help to know possible changes in the (PIB) representing the economic growth in Algeria, that is to say, the government expenses lead to importation according to (Granger). The variance in the government expenses during the period (t-1) by 10% leads to an increase in the period (t) ?? 18 wish 0.64% lead to a slight positive effect in the national economy.
The results also show that the impact of the (PIB), the inflation and the petrol price in the period (t-1) on the importation is due to the compatibility of the PIB. (-0.029) it is each year decreasing by 2.9% which led to an economic balance during 9 years.
The correction of the wrong doing in Ec t-1 in the (VEC) has taken the negative symbol (-) it means that 2.3% of the economic imbalances are corrected each year.
12. VIII. Conclusion
In this study there is a trial to know (to measure) the impact of the public expenses on the Algerian importation.
Where the analysis of the study using the standard tests (tests of static variations. Co-integration Test the model of error correction) has revealed the following:
1-The results of the static variations tests (Augmented Dicker Fuller ) have shown that all the variations of the economic study contain the root of the unity
??Public spending was missing the period (t) is the application first, and influence on the increase in gross product of period (t + 1), so the problem is the non-compliance Temporal between the cause and the result.
that is to say that, it is non -static (or unstable) at its level, then by becoming stable in the first differences which means that it is about an integration of first order.
13. 2-The Co-Integration Test (Johansen and Jusellus )
has shown that there is a Co-Integration vector within the variations which indicate the existence of a long term relation between the public expresses and the imports .
3-The model estimation of the correction vectors of error has shown that the public expresses contributed in the imports but it is weak in short term , this is due to the weak rationalization of the public expenses in Algeria , whereas the results obtained by the determination of the model error correction has been rejected (or refused) as it has been shown that the public expresses are statically abstract whereas the same model has shown that the other model coefficients are abstract and positively influent on the imports in a short term which is in agreement with the economic theory.
14. Global Journal of


| Unit: million American dollars |
| We've used in this study ADF (Augmented | ||||||||||||||||||||||||
| Dickey-Fuller) test. | ||||||||||||||||||||||||
| a) Testing the stability of the variants: (The Unit Root | ||||||||||||||||||||||||
| Test) | ||||||||||||||||||||||||
| Year | ||||||||||||||||||||||||
| Volume XV Issue II Version I | ||||||||||||||||||||||||
| ( ) | ||||||||||||||||||||||||
| Global Journal of Management and Business Research | ||||||||||||||||||||||||
| t LnIMP | = | ? | + | ? 1 | t LnPIB | + | ? | 2 | . | t LnINF | + | ? | 3 | . | t LnPBRL | + | ? | 4 | . | t LnDEP | + | ? | ||
| t | = | , 1 | ,....., 2 | 22 | ||||||||||||||||||||
| 2015 | |||||
| Year | |||||
| 78 | |||||
| Volume XV Issue II Version I C ( ) Global Journal of Management and Business Research | Critical Values 5% Test d'impact Test auto-grande vecteur 69.81 33.87 47.85 27.68 29.79 21.13 15.49 14.26 3.84 3.84 | Johansen and Juselius Test Maximal Eigen Value Statistic Critical Values 1% Test d'impact Test auto-grande vecteur 33.44 77.81 39.37 28.93 54.68 32.71 18.29 35.45 25.86 6.75 19.93 18.52 3.02 6.63 6.63 | Trace Statistic 90.44 57.00 28.07 9.78 3.02 | Eigen Value .796 .747 .581 .275 .134 | Vector 0 = r * 1 ? r 2 ? r 3 ? r 4 ? r See annex N° (02) |
| © 2015 Global Journals Inc. (US) 1 |
| t-statistic | Std.Errors | Coefficients | variabls |
| 4.131 | 0.00134 | 0.0555 | C |
| -1.51440 | 0.015265 | -0.023 | Ec t-1 |
| 0.64 | 00.03125 | 0.0202 | Î?" Ln IMP t -1 |
| -4.272 | 0.00698 | -0.029 | Î?" Ln PIB t -1 |
| 0.197 | 39865.0 | 7864.23 | Î?" Ln INF t -1 |
| 3.081 | 13.30 | 40.99 | Î?" Ln PBRL t -1 |
| 0.331 | 0.175 | 0.0583 | Î?" Ln DEP t -1 |
| 0.84 | R2 | ||
| 0.028 | S.E | ||
| 12.20 | F -Statistic | ||
| -136.87 | Log Likelihood | ||
| See annex N° (03) |
| 5. John Maynard Keynes, 1936, The General Theory of Augmented Dickey-Fuller test statistic Log likelihood -160.6487 Hannan-Quinn criter. 14.80961 economic and legal sciences, vol21, 2nd edition, -5.612547 0.0002 | |||||||
| Employment, Interest and Money (1936). Book I in III,Translated from English by Jean de Largentaye (1942). Editions Payot: Paris, P24. 6. housin mustapha Husin, 2008, Corporate Finance, Office of academic books, Algeria,P28. 7. Boudakhdakh selamna mohammed karim and the impact of increased government spending on unemployment in Algeria 2001 -2009, International coloque on "state strategy for the fight against Test critical values: 1% level 5% level 10% level F-statistic 28.44750 Durbin-Watson stat Syria, P110. 10. *-Mackinnon (1996) one-sided P-values. 11. ** -It has been one slowdown period ( P = 1 ) awarding to the standard ( AIC ). Site Web -3.831511 -3.029970 1.393478 Prob(F-statistic) Vector Error Correction Estimates 0.000032 Date: 10/17/14 Time: 23:06 -2.655194 *MacKinnon (1996) one-sided p-values. Sample (adjusted): 1993 2012 Ln (PBRL) in level. Included observations: 20 after adjustments Null Hypothesis: PBRL has a unit root Standard errors in ( ) & t-statistics in [ ] Exogenous: Constant -Central Bank of Algeria: www.BCA.org.dz Mean dependent Lag Length: 0 (Automatic -based on SIC, maxlag=4) -Directorate General of Customs National Centre of Informatics and Statistics C.N.I.S. R-squared 0.744891 var 749.6316 Adjusted R-squared 0.672003 S.D. dependent var 6865.902 t-Statistic Prob.* Error Correction: D(DEP) D(IMP) D(INF) D(PBRL) D(PIB) | |||||||
| 2015 Year Year Volume XV Issue II Version I Volume XV Issue II Version I | unemployment for sustainable growth," Labo strategies and replicas economic in Algeria Msila universities, November 2011, P83. 8. The ADF test value table is calculated by EVIEW.8 program used in this study, 9. Khalid bin Hamed ben Abdellah El kadire, 2005, the impact of currency shares to finance imports to Saudi Arabia, Journal of damask universities to the S.E. of regression 3932.170 Sum squared resid 2.16E+08 Log likelihood -181.3207 Augmented Dickey-Fuller test statistic CointEq1 -0.023095 -0.115228 -The World Bank B.World. -Ministry of Finance of Algeria: www.MF.dz -National Statistics Office: www.ONS.dz Akaike info criterion 19.61270 Schwarz criterion 19.86124 Hannan-Quinn criter. 19.65477 0.259798 -1.26E-07 0.000990 3.275083 0.9702 Test critical values: 1% level (0.01525) (0.29195) (1.2E-07) (0.00075) (0.86639) -3.769597 5% level -3.004861 [-1.51440] [-0.39468] [-1.05558] [ 1.31321] [ 3.78013] -ONS, Algeria The results in figures 2001 -2011 N 30 2012 Edition. -ONS, Evolution of trade balance of Algeria period F-statistic 10.21965 Durbin-Watson stat 2.068587 Prob(F-statistic) 0.000437 Ln (INF) in level. 10% level -2.642242 D(DEP(-2)) 0.058317 -11.78277 1.16E-06 -0.001356 7.206053 (0.17574) (3.36435) (1.4E-06) (0.00869) (9.98402) *MacKinnon (1996) one-sided p-values. [ 0.33184] [-3.50224] [ 0.84069] [-0.15605] [ 0.72176] 2001 -2012. Annex N o 01. Results of the static variable in the model. (Test Augmented Dickey-Fuller) Ln (PIB) in level. Null Hypothesis: PIB has a unit root Exogenous: Constant Lag Length: 0 (Automatic -based on SIC, maxlag=4) t-Statistic Prob.* Annexe 3 Null Hypothesis: INF has a unit root Exogenous: Constant Lag Length: 0 (Automatic -based on SIC, maxlag=4) t-Statistic Prob.* Augmented Dickey-Fuller test statistic -2.361641 0.1632 Test critical values: 1% level -3.769597 5% level -3.004861 10% level -2.642242 R-squared 0.003363 Mean dependent var 4.04545 5 Adjusted R-squared -0.046468 S.D. dependent var 13.4570 8 S.E. of regression 13.76620 Akaike info criterion 8.16881 7 Sum squared resid 3790.164 Schwarz criterion 8.26800 3 Log likelihood -87.85699 Hannan-Quinn criter. 8.19218 2 2.41548 D(IMP(-2)) 0.020228 0.922107 -2.06E-07 0.000453 -1.556634 (0.03125) (0.59819) (2.5E-07) (0.00155) (1.77518) [ 0.64737] [ 1.54149] [-0.83942] [ 0.29315] [-0.87689] D(INF(-2)) 7864.232 359058.0 -0.337666 1366.105 1590281. (39865.0) (763171.) (0.31272) (1971.13) (2264778) [ 0.19727] [ 0.47048] [-1.07978] [ 0.69306] [ 0.70218] D(PBRL(-2)) 40.99903 40.39957 -3.05E-05 0.728436 1559.388 (13.3030) (254.672) (0.00010) (0.65777) (755.761) | Volume XV Issue II Version I Year 2015 Year Year Volume XV Issue II Version I Volume XV Issue II Version I | |||||
| ( ) C ( ) C | Augmented Dickey-Fuller test statistic *MacKinnon (1996) one-sided p-values. F-statistic 0.067495 Prob(F-statistic) 0.797675 [ 3.08194] [ 0.15863] | -1.384300 Durbin-Watson stat [-0.29189] [ 1.10743] 0.5710 | 6 | [ 2.06334] | ( ) C ( ) C ( ) C | ||
| Test critical values: *MacKinnon (1996) one-sided p-values. 1% level 5% level 10% level R-squared 0.087437 var Adjusted R-squared 0.041809 var S.E. of regression 19416.19 criterion Mean dependent -3.769597 -3.004861 -2.642242 S.D. dependent Akaike info Sum squared resid 7.54E+09 Schwarz criterion Log likelihood -247.3932 Hannan-Quinn criter. F-statistic 1.916288 Durbin-Watson stat Prob(F-statistic) 0.181519 R-squared 0.218058 Mean dependent var 0.000329 -1868.386 19835.26 22.67211 22.77130 22.69548 1.829762 Adjusted R-squared 0.178961 S.D. dependent var 0.001999 S.E. of regression 0.001812 Akaike info criterion -9.702587 Sum squared resid 6.56E-05 Schwarz criterion -9.603401 Log likelihood 108.7285 Hannan-Quinn criter. -9.679222 F-statistic 5.577348 Durbin-Watson stat 1.658639 Prob(F-statistic) 0.028450 Ln (DEP) in level. Null Hypothesis: DEP has a unit root Exogenous: Constant Lag Length: 0 (Automatic -based on SIC, maxlag=4) t-Statistic Prob.* Augmented Dickey-Fuller test statistic 5.333620 1.0000 Test critical values: 1% level -3.769597 5% level -3.004861 10% level -2.642242 Annex N o 02. Results On integration of common variables in the model test. (Test Johansen and juselius) abstract level at 1 % Date: 10/17/14 Time: 22:44 Sample (adjusted): 1992 2012 Included observations: 21 after adjustments Trend assumption: Linear deterministic trend Series: DEP IMP INF PBRL PIB Lags interval (in first differences): 1 to 1 Unrestricted Cointegration Rank Test (Trace) Hypothesized Trace 0.01 No. of CE(s) Eigenvalue Statistic Critical Value Prob.** None * 0.796570 90.44752 77.81884 0.0005 At most 1 * 0.747877 57.00644 54.68150 0.0055 At most 2 0.581448 28.07188 35.45817 0.0780 At most 3 0.275159 9.781860 19.93711 0.2979 D(PIB(-2)) -0.029830 -0.156907 2.20E-08 -0.000673 -0.814795 (0.00698) (0.13366) (5.5E-08) (0.00035) (0.39665) [-4.27248] [-1.17391] [ 0.40150] [-1.94977] [-2.05417] C 555.9196 7498.629 -7.93E-05 1.091921 -11601.77 (134.568) (2576.15) (0.00106) (6.65372) (7644.95) [ 4.13116] [ 2.91079] [-0.07512] [ 0.16411] [-1.51757] R-squared 0.849222 0.555150 0.240893 0.323094 0.597073 Adj. R-squared 0.779632 0.349834 -0.109464 0.010677 0.411107 Sum sq. resids 1030116. 3.78E+08 6.34E-05 2518.461 3.32E+09 S.E. equation 281.4955 5388.922 0.002208 13.91861 15992.11 F-statistic 12.20323 2.703887 0.687564 1.034174 3.210653 Log likelihood -136.8733 -195.9130 98.24088 -76.73548 -217.6680 Akaike AIC 14.38733 20.29130 -9.124088 8.373548 22.46680 Schwarz SC 14.73583 20.63980 -8.775581 8.722054 22.81530 Mean dependent 820.0000 731.2500 0.000287 4.650000 -2070.225 S.D. dependent 599.6490 6683.284 0.002096 13.99351 20839.52 Ln (IMP) in level. At most 4 0.134112 3.023999 6.634897 0.0820 *MacKinnon (1996) one-sided p-values. Determinant resid covariance (dof adj.) 1.41E+16 Null Hypothesis: IMP has a unit root Exogenous: Constant Lag Length: 3 (Automatic -based on SIC, maxlag=4) R-squared 0.587182 Mean dependent var Determinant resid covariance 1.64E+15 831.8182 Adjusted R-squared 0.566541 S.D. dependent var 571.8694 Log likelihood -492.2212 | Management and Business Research Global Journal of Management and Business Research Global Journal of Management and Business Research | ||||||
| S.E. of regression Sum squared resid | t-Statistic 376.5051 Akaike info criterion 2835121. Schwarz criterion | 14.78625 Prob.* 14.88543 | |||||
| © 2015 Global Journals Inc. (US) 1 | |||||||