1. Introduction
n Efficient Market Hypothesis (EMH) it is assumed that the current market price of a security reflects all the information of the respective security and investors by using the information content in the historical price cannot be able to predict current or future price to make abnormal return even if the market is efficient at its weak form (Fama 1970). So the tests of Weak Form Market Efficiency basically try to find out whether there is any relationship between the past prices and the current price, in other word whether the current price can be predicted by using the past prices of a security. By being one of the central areas of research interest during the last couple of decades, this area has showed its development in many phases.
The first formal test of market efficiency could be found when Kendall (1953) applied serial correlation coefficient test on weekly changes of nineteen indices of UK industrial stock prices and found near zero correlation coefficient, which supported the market to be complied with random walk model. After that so many studies have been conducted on some other developed markets. If we take a look at the literature up to the year 1970, most of the studies were found to be consistent with market efficiency (Kendall 1953;Fama 1965;Fama & Blume 1966;James 1968;Jensen & Benington 1970;etc.), though subsequently several studies came up with a totally opposite finding (Lo & MacKinlay 1988;Sweeny 1988;Brock et al. 1992;etc.). But to be more precise developed markets are found to be weak form efficient in so many studies (Kendall 1953;Fama 1965 Many studies have also been documented on emerging stock markets. But those are mainly based on statistical tests of independence like: serial correlation coefficient tests, runs tests, tests of normality, variance ratio test and stationarity test, etc. The evidence from emerging markets can be presented by dividing these markets into four areas. Firstly if we look at the Asian markets then we see Poshakwale (1996), Kumar & Dhankar (2011) and Gupta & Yang (2011) did their studies on Indian Stock Markets and concluded the market to be inefficient. In some other studies Moustafa (2004) As the review from literature shows mixed result, the efficiency of these markets has remained always inconclusive. At the same time, chronological development of testing methods in this field like using time series regression models (Fama & French 1988;Poterba & Summers 1988), applying variance ratio test (Lo & Mackinlay 1988) The next few chapters of this paper will include some reviews from the relevant literature and justification of this study, the research questions which it will address and the objectives of the research, data sources and detailed research methodology, findings of this research, and in the final section it will make concluding remark along with some recommendations.
2. II.
3. Literature Review
In order to test Weak Form Market Efficiency some of the researchers approached through statistical tests of independence like Serial Correlation Coefficient test (Kendall 1953;Fama 1965), runs test (Fama 1965) and some other approached through test of technical trading rules like filter rule (Alexander 1961 Practically capital market is not frictionless; hence the profitability of trading rules can be challenged with the existence of transaction costs. Fama & Blume (1966) confirmed that Alexander's results overstated the profit and x% filter rule would not outperform buy and hold policy considering the higher transaction costs. Van Horne & Parker (1967) also concluded the NYSE to be consistent with random walk hypothesis after examining it with moving average technical trading rules. Sweeny (1988) came up with a different conclusion from that of Fama & Blume (1966) on DJIA. He used some new filter rules and found the trading rules were more useful than Fama & Blume did. He added that floor traders can be able to obtain data at a lower transaction cost. James (1968) applied monthly moving averages trading rule on the listed common stocks of NYSE. His results were consistent with random walk hypothesis as he found buy and hold policy was better off in most of the cases. Jensen & Benington (1970) has conducted relative strength trading rule on twenty nine independent samples of two hundred securities of NYSE and confirmed that the market was efficient as the trading rule could not earn more than buy and hold policy after netting the transaction costs. Brock, Lakonishok & LeBaron (1992) used two technical trading rulesmoving average and trading range break on DJIA and found the evidence of profitability of trading strategies. The study of Brock et al. (1992) was replicated on UK market by Hudson, Dempsey & Keasey (1996) and they came up with the finding that technical trading rules cannot generate excess return if cost of transaction is considered. But they confirmed that technical trading rule may exhibit some predictability.
So far most of the trading rules like moving averages used in academic research are basically trend indicators which practitioners do not use in predicting the stock price in isolation, as they think these would be too naive to capture the information content in the past prices. Loh (2007) applied a test of technical trading rule based on practitioner's approach on five developed Asian-Pacific stock markets: Australia (ASX), Hong Kong (HKSE), Japan (NIKKEI), South Korea (KOSPI) and Singapore (STI), for the time period 1990 to 1995. His test basically denoted as combined test of trend indicator (moving average) and confirming indicator (stochastic oscillator). He got two interesting results from his analysis-a combined strategy is more effective compared with a simple moving average technique, and weak form efficiency is not determined by technological progress but factors.
In fact there are a very few studies on test of technical trading rules in Dhaka Stock Exchange and was none before Kader & Rahman (2005) tested K% filter rule in Dhaka Stock Exchange and concluded it as weak form inefficient. After that Hussain, Chakraborty & Kabir (2008) have tested Moving Average 50, 100, and 200 rules over a big data set from 1986 to 2008 with 5815 observations. They found all the MA rules could outperform buy and hold strategy even considering 0.5% transaction cost for both buy and sell.
Most of the previous studies fail to address the practitioner's viewpoint. As the practitioners very often do not use the trend indicator solely rather they adopt some confirming indicator combined with the trend
4. Global Journal of Management and Business Research
Volume XIV Issue VI Version I Year ( )
Cindicator to create more accurate and sophisticated technical trading rules, the tests which have included only the simple trading rules may not be able to capture the complete information content in the past prices. Considering this fact Loh (2007) adopted moving averages combined with stochastic oscillator in his study and contributed some new findings. In addition to the methodology of Loh (2007) this study has included longer length moving averages to make better comparison among the trading rules. This is the first time applied test of its kind in this country market. It has compared the findings between the traditional approach (simple moving averages) and the practitioners' approach as well as showed the profitability of these rules over buy and hold strategy even after considering the transaction costs.
5. III. Research Questions and Objectives
This study is going to address the following research questions: IV.
?6. Research Methodology and Data Sources
Fama (1991) suggested that the test of weak form market efficiency basically denotes to the test of return predictability, which means to find out whether the past return series can predict the future return series. Fama (1965a) described two approaches for test of return predictability for the researchers. The first approach is to use some statistical tools like Serial Correlation Coefficient test, Runs test, etc. to find out whether the past return series is random and statistically independent, so that the chartist or technical analyst cannot be able to predict the prices to earn more return than that of a buy and hold strategy. The second approach is to formulate some suitable technical trading rules and use these directly on the recent market prices to predict the market trend and to find out whether these trading rules are profitable or not. If the trading rules are profitable and can earn more return than that of a buy and hold strategy then it can be concluded that return is predictable and the market is weak form inefficient. Reilly & Brown (2004, p. 180) has named these two test approaches as firstly, Statistical Tests of Independence, and secondly, Tests of Trading Rules. In order to conduct the Test of Trading Rules, mainly the methodology of Loh (2007) has been followed here. Though Loh (2007) This study is going to test the first three trading rules. A brief description of these rules and signaling process is provided here.
7. Moving Average Trading Rule
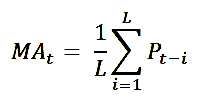
Moving Averages are very famous but simple and easy to use trading rules. Moving Average Trading Rule basically works with buy and sell signals received from the movement of a short run moving average (SRMA) and a long run moving average (LRMA). The formula for calculating a moving average is given below:
Here, MA t is the moving average for the time period t, L denotes to the length of moving average. P is the stock or index price. The value of L in an SRMA t ranges from one to five days. On the other hand the length of moving average L in an LRMA t depends upon the investors' preferences as the investors may like to track run, intermediate or long run trends in the stock prices. Generally L is observed to be 200 days in a long run moving average. If the value of L in SRMA t is one then the moving average is known as Single Moving Average, because, then the price series directly can be After generating a buy (sell) signal the position will be continued before another sell (buy) signal is generated by the moving average process discussed above. Hence the holding period (days) in buy position will be (Db): SRMA t >LRMA t , and in the same way the holding period (days) in sell position will be (Ds): SRMA t <LRMA t .
8. Moving Average combined with Stochastic Oscillator
Most of the studies on Tests of Moving Averages as a trading rule have included only these single or double moving averages, but from the practitioner's view point depending only on the trend indicator might be misleading. Hence an inclusion of another confirming indicator named 'Stochastic Oscillator' along with the moving averages would be more meaningful. So this study is also going to test the combined signal of moving average and stochastic oscillator. The construction method of a stochastic oscillator is described below: DL t = P t -min (P t , P t-1 , ....., P t-m+1 ) HL t = max (P t , P t-1 , ....., P t-m+1 ) -min (P t , P t-1 , ....., P t-m+1 ) K t = (DL t / HL t ) × 100
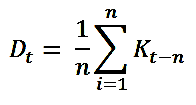
Here, DL t denotes to the difference between the current closing price and the recent lowest price over a predefined period, m. Generally m is assumed as 14 by the practitioners, but this study has considered m equals to L in the LRMA t (Loh 2007). In the same way HL t is the difference between the recent highest closing price and lowest closing price. K t is the ratio of latest price range to recent price range. In order to generate a confirming signal K t is compared with another signal line named D t , which is calculated in the following way: So from the formula above it is quite clear that D t is an n-period moving average of K t . 'n' is commonly assumed as 3 by the practitioners. But in this study n equals to L in the SRMA t is assumed (Loh 2007). The main intuition behind this strategy is-if the line K t intersects D t from below then it is assumed by the traders that the market has moved from an oversold to an overbought position so a buy signal is generated and vice-versa. Finally a trading strategy based on moving average combined with stochastic oscillator will look like the same as below: Buy signal at time period t (BS t ): SRMA t >LRMA t and SRMA t-1 < LRMA t-1 and K t >D t Sell signal at time period t (SS t ): SRMA t <LRMA t and SRMA t-1 > LRMA t-1 and K t <D t A buy (sell) position will be continued until a sell (buy) signal is generated by both the indicators simultaneously.
Besides the profitability, this study will also compute the break even cost (BEC) of the trading strategies. The main idea behind this BEC is that, if the trading cost is below the BEC then the strategy will be profitable despite the existence of cost of trading. The formula for calculating BEC is given below:
BEC t = (D b × M b -D s × M s ) / (2 × (N b + N s ))Here, D b and D m are the total number of buy and sell days and M b and M s are average daily return from buy days and sell days respectively. N b and N s denote to the number of buy and sell signal respectively. As each buy (sell) signal is associated with a sell (buy) signal, the total number of buy and sell signals are multiplied by 2.
9. Data
This study has considered daily price data of two indices of Dhaka Stock Exchange (DGEN and DSE20) from the year 2002 to 2010. Here data after the year 2010 has been ignored intentionally, because, at the end of the year 2010 Bangladesh faced severe capital market turmoil which persisted for a long time and at the beginning of the year 2013 Dhaka Stock Exchanged replaced its previous two indices with new ones. In order to calculate the return series the following formula has been used (ignoring the dividends): Return on index at time period t = Ln (MI t ) -Ln (MI t-1 )
Here, Ln denotes to natural logarithm, MI t is the market index price at time period t and MI t-1 is the price of index at time period previous of t. The standard t-test (one tailed two sample unequal variances t-test) has been used to find out whether the mean return from trading strategy is significantly higher than the mean return from buy and hold strategy. If the profitability of these trading strategies is confirmed over that of the buy and hold strategy then the weak form efficiency of this market will be questionable.
V. combined with Stochastic Oscillator, MASO 5-50, MASO 5-200) will be applied on DGEN and DSE20 return series to find out whether these are profitable and can outperform the buy and hold strategy. predicting movement of the stock price than that of the long length moving averages . For MA 1-50 trading rule the accuracy in predicting the immediate upward or downward movement of index price (DGEN) is 100%. But at the same time it should be noted that the number of transaction is also higher for the short length moving averages . So if the trading cost is very high in a market, the short length MA rules may not show that much profitability which is observed from the table 5.11. In this study, a confirming indicator which is known as stochastic oscillator is used with Moving Average to improve the predictability and profitability of the moving average trading rules. Here it is found that using stochastic oscillator with moving average improves only the short length moving average (compare MA 5-50 and MASO 5-50), but for the long length moving average (Compare MA 5-200 and MASO 5-200) the result becomes reversed. So the result does not fully support the findings of Loh (2007).
10. Empirical Results
11. In
Table 5.12 shows all most in all the cases (except for two cases) the holding days are found correct for more than 50% of days. Differences are significantly different from '0' at 5% and 1% level of significance. BUY must be positive and SELL must be negative in order the trading rules to be held successful in predicting the market movements. Besides, using stochastic oscillator as a confirming indicator improves the predicting capacity of MA 5-50 rule in both buy and sell cases, which also complies with the findings of Loh (2007). But the same is not true for MA 5-200 rule. Rather the predictive ability has been decreased when we used stochastic oscillator. So it can be inferred that using stochastic oscillator as a confirming indicator may not applicable for improving the performance of longer length moving averages as Loh himself used MA 5-20 and MA 5-60 in his study. Up to this it has not been revealed whether a complete strategy can outperform the buy and hold strategy and Table 5.14 will be helpful in this regard. We assume here a complete strategy like holding the index in buy position in buy signal days and holding it in short position in sell signal days rather comparing these as a separate strategy. Average daily return of the whole holding period is calculated. This is the most interesting part of this study as now it becomes quite apparent that only MA 1-50 rule can outperform the buy and hold strategy. Because, though all other trading rules showed greater return than buy and hold strategy (except for only a few exceptions) in Table 5.11, only MA 1-50 (for both DGEN & DSE20) shows statistically significant higher return than that of buy and hold strategy in Table 5.14. This result also complies with the findings of some earlier studies where short length moving averages performed better than the long length moving averages in the markets bearing short trend in price series (Isakov & Hollistein 1999;Lento 2007).
12. VI.
13. Conclusion
Tests of trading rules conducted in this study reveal the profitability of trading rules set on Dhaka Stock Exchange even after considering transaction costs. It implies that investors of Bangladesh can apply different technical trading strategies to predict the market movement and earn return without bearing appropriate risk. Moreover, by combining the confirming indicator along with the trend indicator the return predictability of short length moving averages can be increased significantly. As the trading rules are found to
14. Global Journal of Management and Business Research
Volume XIV Issue VI Version I Year ( ) C significantly outperform the buy and hold strategy, the market is not following weak form of efficiency. Findings from the previous chapter and also from the previous studies confirm that Dhaka Stock Exchange is suffering from weak form market inefficiency and the information content in the past prices does not reflect in the current market price of securities, which is alarming for the general investors of this market. To address the issues related to weak form market inefficiency, policies should be taken to remove information asymmetry, i.e. improving the disclosure policies, creating awareness among the investors, etc. In order to uphold the general investors' interest the regulatory authority can control the opportunities of making excess return by violating the market structures. Educational and training initiatives should be taken and increased to disseminate basic investment knowledge to the investors so that they can make informed decision. Besides growing number of actively traded securities and quality IPOs can also help to enhance the securities trade flow, which may further help in raising informational efficiency in this market.
15. Global Journal of Management and Business Research
Volume XIV Issue VI Version I Year ( ) C

| Now the process of generating buy and sell | |
| signals from a moving average will be discussed. A buy | |
| (sell) signal is generated when SRMA t intersects LRMA t | |
| from below (above): | |
| Buy signal at time period t (BS t ): SRMA t >LRMA t and | |
| SRMA t-1 < LRMA t-1 | |
| Sell signal at time period t (SS t ): SRMA t <LRMA t and SRMA t-1 > LRMA t-1 | Year |
| Volume XIV Issue VI Version I | |
| ( ) | |
| Global Journal of Management and Business Research |
| Trading Rules | N b | N s | F b % | F s % | Absolute | Absolute Return from Buy |
| Return * % | and Hold Strategy % | |||||
| DGEN | ||||||
| MA 1-50 | 48 | 48 | 100 | 100 | 506 | 236 |
| MA 1-200 | 15 | 15 | 100 | 100 | 319 | 224 |
| MA 5-50 | 31 | 30 | 70.97 | 76.67 | 295 | 236 |
| MA 5-200 | 10 | 10 | 80 | 60 | 243 | 224 |
| MASO 5-50 | 28 | 25 | 78.57 | 84 | 309 | 236 |
| MASO 5-200 | 8 | 7 | 87.50 | 85.71 | 110 | 224 |
| DSE 20 | ||||||
| MA 1-50 | 50 | 50 | 94 | 96 | 437 | 236 |
| MA 1-200 | 19 | 19 | 94.74 | 68.42 | 284 | 224 |
| MA 5-50 | 30 | 29 | 63.33 | 68.97 | 254 | 236 |
| MA 5-200 | 8 | 8 | 75 | 75 | 232 | 224 |
| MASO 5-50 | 26 | 27 | 73.08 | 70.37 | 271 | 236 |
| MASO 5-200 | 6 | 8 | 83.33 | 75 | 196 | 224 |
| Note: |
| Year | ||||||||
| Trading Rules DGEN MA 1-50 MA 1-200 MA 5-50 | D b 1427 1298 1462 | D s 777 698 774 | B c % 62.16 59.24 58.28 | S c % 58.82 51.86 52.45 | BUY= M b -M h 0.001546** (3.8413) 0.001045* (2.4282) 0.000763 | SELL= M s -M h -0.002789** (-5.6396) -0.001728** (-3.2456) -0.00143** | B -S =M b -M s 0.004335** (8.1858) 0.002773** (4.8518) 0.002194** | Volume XIV Issue VI Version I ( ) C |
| (1.9097) 0.000761 (1.7651) 0.000786* (1.9756) 0.000603 (1.2943) 0.00166** (3.9482) 0.001049* (2.3864) 0.0009295* (2.2078) 0.000827 (1.8842) 0.001024* (2.4232) 0.000882 (1.9407) Note: D b (D s ) means holding period in buy (sell) days; B c (S Global Journal of Management and Business Research (-2.8900) (4.1558) MA 5-200 1292 702 58.13 49.57 -0.001162* (-2.1886) 0.001923** (3.3689) MASO 5-50 1482 754 58.23 52.65 -0.001535** (-3.0691) 0.002321** (4.3681) MASO 5-200 1017 977 57.32 46.57 -0.000457 (-0.9675) 0.001059 (1.9421) DSE 20 MA 1-50 1240 997 62.74 55.47 -0.002058** (-4.5515) 0.003718** (7.3601) MA 1-200 1212 786 59.74 51.40 -0.001435* (-2.8175) 0.002485** (4.4562) MA 5-50 1235 1002 59.43 51.30 -0.001139* (-2.5237) 0.0020689** (4.0970) MA 5-200 1218 778 58.95 50.13 -0.001102* (-2.1540) 0.0019287** (3.4517) MASO 5-50 1221 1016 60.11 51.97 -0.001224** (-2.7250) 0.002248** (4.4579) MASO 5-200 1092 904 59.24 49.11 -0.000899 (-1.8556) 0.001782** (3.2548) | ||||||||
| Trading Rules | Break Even Cost (BEC) % |
| DGEN | |
| MA 1-50 | 2.63 |
| MA 1-200 | 2.24 |
| MA 5-50 | 2.42 |
| MA 5-200 | 2.43 |
| MASO 5-50 | 2.91 |
| MASO 5-200 | 3.67 |
| DSE 20 | |
| MA 1-50 | 2.18 |
| MA 1-200 | 3.73 |
| MA 5-50 | 2.15 |
| MA 5-200 | 7.26 |
| MASO 5-50 | 2.56 |
| MASO 5-200 | 7.02 |
| Trading | Mean Return | Mean | t- |
| Rules | (Trading | Return | statistic |
| Rules) | (Buy and | ||
| Hold | |||
| strategy) | |||
| DGEN | |||
| MA 1-50 | .00226 | .00105 | 3.425 * |
| MA 1-200 | .00154 | .00107 | 1.230 |
| MA 5-50 | .00131 | .00105 | 0.745 |
| MA 5-200 | .00117 | .00107 | 0.243 |
| MASO 5-50 | .00138 | .00105 | 0.922 |
| MASO 5-200 | .00053 | .00107 | -1.448 |
| DSE 20 | |||
| MA 1-50 | .00195 | .00105 | 2.540 * |
| MA 1-200 | .00137 | .00107 | 0.784 |
| MA 5-50 | .00113 | .00105 | 0.227 |
| MA 5-200 | .00112 | .00107 | 0.121 |
| MASO 5-50 | .00121 | .00105 | 0.444 |
| MASO 5-200 | .00095 | .00107 | -0.335 |