1.
the level, quality, and distribution of human capital and economic growth, income distribution, and poverty reduction. This case is further reinforced by the lack of readiness of most education systems in MENA to deal with globalization and the increasing emphasis on knowledge in the development process, the region's enormous youth bulge, and the additional financial resources required expanding higher levels of instruction, having essentially achieved full enrollment at the primary level (World Bank, 2004).
Neither growth rates nor education appear to have contributed to the low poverty levels of the region. The main reasons for low poverty rates in the MENA seem to be actively pursued redistributing income through various mechanisms: (1) relatively moderate and somewhat declining inequality of income distribution, so whatever growth rates in GDP per capita occurred, they contributed to higher consumption per capita for the poor despite slower economic growth rates; and (b) income support programs by the state to the poor families such as Jordan. Jordan poverty rates fell despite low economic growth in the 1990s. Further, poverty rates are lower in East Asia and MENA than in Latin America, and are declining within countries in MENA that have had more rapid rates of growth. These policies seem to have had a much more direct effect on reducing poverty than educational investment policies because they directly affect the incomes of lowerincome families rather than depending on the indirect effects of educational investment (Galal, 2008).
In Jordan, the Ministry of Higher Education gave higher education sector its attention during the last two decades as its perceived role in the comprehensive development of industrial, commercial, business, agricultural, and health sectors. The development of higher education sector has been on content, programs, and pedagogy that control quality and quantity. The development focused on international standards that provide competitiveness of graduates at the regional and international level. Seven cores of focus were adapted that included: university management; admission procedures and equal opportunities; accreditation and quality assurance; scientific research, development and graduate studies; IT and technology skills; funding; and learning environment. Evaluation and assessment as initiatives for higher education development in Jordan is considered to be a central core for quality assurance. However, to realize the importance of such vision it is important to focus on the base of education at the school level. To match these goals, the Ministry of Education was accredited the ISO9001 for Management and Quality Assurance in its educational and other activities that targeting the development of human resources (teachers and students) at the school level (National Strategy for Higher Education and research, years 2007-2012).
How such implemented development plans can be adopted to local communities that are the most in need for socio-economic sustainable development like the Governorate of Mafraq. Such vital development includes the simplest executive jobs to the most complex management ones required. a) Importance and Significance of the Study Statistics of 2004 show that applied science majors are not established in schools within the dispersed human settlements of Mafraq Governerate from the urban center, Mafraq City. Additionally, the further settlements are from the capital city Amman, the less such majors are offered to local communities. Whilst, such majors qualify high school students to be accepted to applied science majors at the university level such as agriculture, arid land development, resources management, engineering, architecture, nursery, and medicine that are believed to be the most needed by the local market in Mafraq Governerate (Department of Statistics, 2004).
Being the first of its kind, the present study emphasizes the role of human resources development at the educational institutions level in providing qualitative and competitive graduates to Mafraq Governerate market. Such investment can enhance socio-economic security for the local community. This research can be a model for local communities with socio-cultural and economic limitations.
The researchers are expected to gain more expertise in the development and evaluation of educational systems and pedagogy, and their relation to market needs.
Goals of the study are to diagnosing the relevance of inputs and outputs of higher education that will make Mafraq Governorate dependent on its own human resources. The study outcomes will provide a set of guidelines towards making educational environments more efficient.
2. a) Challenges Facing Education Sector
The conditions under which education systems contribute to economic and social development have changed and this argues for considering alternative paths of education development. For many developing countries, an abundant supply of low-wage, unskilled labor used to be a route to rapid growth and national prosperity, but this is no longer so. Several new challenges have been introduced: (1) Globalization and the increasing importance of knowledge in the development process to excel in a more competitive environment. (2) Clients to be served by the education system have also changed. (3) The number of eligible students seeking post-compulsory education is expected to increase considerably over the next decades. (4) The education systems will need to become more effective in transmitting skills and competencies to all. (5) Facing these new challenges will be costly (Galal, 2008).
In an ever-changing labor market, students, graduates and postgraduates have to be prepared in accordance to the existing demands. Through the centuries, universities have shown that they are able to adapt to new challenges. Because of this ability, universities have been able to survive as institutions of knowledge and learning. Presently universities are challenged by other knowledge producers, by other education providers, by new technologies and finally by students and employers (Weimer, 2000). Also, the tendency of economies and businesses to operate globally is clearly increasing. The job market not only looks for skilled specialists in a particular field but more and more they require additional skills, such as languages, ICT knowledge, and soft skills. Universities provide organizational means searching new methods of collaboration with partners in economy. Collaboration may provide, with very important feedback information, help to respond to the demands of employers and change or development of study programs, as well as teaching and learning strategies (Valiulis, 2003). Specialization is to be encouraged as to study any subject may have an educational value for those who can benefit from it quite apart from the intrinsic merit of the particular course (Robbins, 1963). b) Challenges Facing the Education Sector in Jordan i. Globalization and Knowledge Economy:
The contribution of education and human resources to the overall index is significant in Jordan. The individual needs of the students are not commonly addressed in the classroom; there is little consideration of individual differences in the teaching-learning process. Current pedagogical practices lack support for weak students, although Jordan appears to be making additional investments in this area. In addition, Jordan's education system is one of the region's most flexible in Vocational Education and Training (VET) (Galal, 2008). In 2000, the Jordanian Higher Education Accreditation Council was established along with methods to conduct internal and external evaluation of university programs. Jordan possesses education systems that exhibit better engineering, more aligned incentives, and greater public accountability than some countries in the region (Galal, 2008). ii. Education Finance: Jordan allocates less than 15 percent of their budget to education. In the 1980s, Jordan constructed science labs and libraries in rented and government-owned facilities to improve the teaching of science. In the late 1980s, Jordan introduced information system to improve decision making at the central and governorate levels. In Jordan, services were contracted out to the private sector since 2000 (e.g., development of curricula and pedagogical tools, teacher trainings, and installation of ICT equipment) (Galal, 2008). iii. Enrollement: Jordan is relatively more successful in providing more equitable access and higherquality education to their population than other countries. Jordan currently has average Net Enrollment Rate (NER) above 90 percent. Jordan experienced temporary setbacks in enrollment rates before recovering and continuing their paths of growth in 1995. As for secondary education, Gross Enrollment Rate (GER) today for Jordan is 85 percent or more.
By 1990, Jordan had surpassed the benchmark of the average higher education for the region, which has quintupled from 5 percent in 1970 to 24 percent today. Jordan constitutions also guarantee the right of education for all, but no commitment is made that education will be provided by the state for free. These constitutional commitments were made typically in the wake of independence from colonial powers and have put pressure on governments to deliver. Over the period 1970-2003, Jordan was relatively more successful in providing access to reasonable-quality education for most of their populations than were the rest of the countries in the region. Jordan has increasingly relied on households to contribute to the cost of publicly provided education through the payment of fees, and has also encouraged private provision of education, especially at the tertiary level. Historically, the private sector played a modest role in the provision of education (Galal, 2008). iv. Gender: Gender parity was reached before full primary enrollment; female students outnumber male students by a significant margin. Jordan currently has the most equal education distribution in the region. Averaging the scores for the adult literacy rates and TIMSS indices, Jordan score particularly high. Since the 1960s, despite the Six-Day War for Jordan, the civil war in Lebanon, the Iran-Iraq War for Iran, and the Gulf War for Kuwait, Jordan was able to protect its education systems. Jordan performed well in meeting education objectives though it has low per capita income (Galal, 2008).
v. Education and Migration: Among the 195 countries studied by Docquier and Marfouk (2004), Jordan is among the top 30 countries with the proportion of skilled emigrants in the total emigration stock, and is ranked 27 (Galal, 2008). Migration is an important channel for resolving local market imbalances with potentially large benefits to the individuals and nations involved. Labor movement is particularly important for the MENA because one of the region's main characteristics is excess labor in Jordan and excess capital in another (such as the Gulf Cooperation Council Countries).
Jordan export workers to the Gulf, but also imports uneducated workers from neighboring countries like Egypt and Syria. The demand for Arab workers in the Gulf, according to Girgis (2002), is expected to fall. Nationals are given skilled jobs at higher wages. Asian workers are increasingly given unskilled jobs at lower wages and at wages below those of workers from Arab countries.
For both the educated and uneducated individuals in countries like Jordan higher wages overseas are an important pull factor to convince some to migrate. The rates of return to education in countries like Jordan are low and declining (Galal, 2008). vi. Social Challenges and Market Demands: Students and parents increasingly favor professional degree programs that help graduates firstly to get a job, rather than a liberal education that is capable of enriching their lives. Society is telling universities that although educational quality is important, the cost of education is even more important. At the same time, the labor market seeks low-cost quality services rather than prestige. This could be because a culture of excellence, which has driven the evolution of education and competition among universities, is no longer acceptable or sustained by the public. Although this shift from prestigedriven to cost-competitive market forces may broaden, the mission and capacity of many universities could be at the expense of the excellence of the best educational institutions (Duderstadt, 1999). Excessive attractiveness of some study programs causes not only disproportion in the market for specialists, but also partly compromise it (Valiulis & Zavadskas, 1999;Valiulis, 2003).
3. c) Marketing Higher Education
A number of authors have recognized the increasingly important role that marketing is playing in higher education institutions' efforts to attract new students (Carlson, 1992;Fisk & Allen, 1993;Murphy & McGarritty, 1978;Wonders & Gyuere, 1991). Marketing actually is linked to needs assessment, market research, product development, pricing, or distribution (Kotler & Fox, 1995;Murphy & McGarrity, 1978). In a higher education context, many customers have been recognized; parents, alumni, donors, the community at large, the government and prospective employers, but the primary customer remains the student (Conway, MacKay & Yorke, 1994;Robinson & Long, 1987;Scott, 1999;Wallace, 1999).
When universities offer qualifications that satisfy student needs, marketing mix alluded to a set of controllable variables that an institution may use to produce the response it wants from its various publics through a 4Ps-type analysis (Product, Price, Place and Promotion) (Kotler & Fox, 1995). Price relates to aspects such as the tuition fees, bursaries and scholarships and payment terms for tuition fees. Place is the distribution method, be it face to face or by distance learning.
Promotions is comprised of a package of tools such as advertising, public relations and face-to-face selling that could take place at an open day. With the intangible nature of the services, some call for a fifth element, people (Coleman, 1994;Gray, 1991;Keller, 1983;Lin, 1999) and physical facilities (Kotler & Fox, 1995), to be added.
4. d) Incentives and Accountability in Demand and Supply
Arab coutries has tended to focus too much on engineering education and too little on incentives and public accountability. No systematic attempts have been made to link the performance of schools and teachers to student results, to put in place effective monitoring mechanisms, or to make information about school performance available to parents and students. Parents and students do not have adequate mechanisms to influence education objectives, priorities, and resource allocation (Galal, 2008).
i. Aligning incentives on the demand side: Education is an investment and its reform has to be seen as part of a larger reform process of the entire economy (Panizza, 2001). The proposed reforms to encourage labor-intensive growth include measures to reduce the bias against exports (Galal and Fawzy, 2001) and measures to rationalize the prices of capital relative to labor (Radwan, 1998;Fawzy, 2002).
It is important, however, that additional reforms to be undertaken to shift the demand for labor from the government to the private sector. This can be achieved in part by discouraging employment in government. At the same time, attention should be given to the informal sector, which is the most important source of employment (Assaad, 1994). ii. Aligning incentives on the supply side: On-going reforms require improving the supply quality of schools that include: (1) Aligning the incentives of teachers, bureaucrats, and private sector education providers to produce good quality education is difficult but necessary. In public schools, it requires motivating teachers to teach effectively in the classroom through performance based financial and pecuniary rewards, in addition to improving the training of teachers. It also involves decentralization and the engagement of parents in the activities of the school, possibly including the selection of teachers. In addition, it involves: (a) greater competition among schools by allowing students to enroll in the school of their choice on the basis of systematic information prepared by the Ministry of Education; (b) fair competition and the availability of accurate information about school performance; (c) retainment of its authority to verify equal access and a minimum curriculum for all students; and (d) resolvement of disputes between schools and parents to fulfill the role of an arbitrator based on a set of previously known rules, procedures, and penalties. In private schools, profit maximization and competition take care of many of the motivational problems noted above. (2) Improving the physical quality of schools, and upgrading of the curriculum by increasing pressure on the treasury to spend sufficiently on building and maintaining schools and by delivering services that are not an integral part of the education process (Galal, 2002).
5. e) Quality of Educational Environment Impact on Students Performance
Educational environment is the setting where interaction between students and teachers takes place. There is evidence that situational (environmental) positions and dispositional (personality) characteristics and attitude towards school (Gump, 1987;Weinstein, 1985;Totusek & Staton-Spicer, 1982;Koneya, 1976) affect students' performance. Students and teachers' personality characteristics and attitude towards school (Brooks & Rebeta, 1991;Gump, 1987;Weinstein, 1985;Totusek & Staton-Spicer, 1982) affect student's performance. Interactions between environment factors and the personal characteristics of students do exhibit significant effects on the academic performance (Lewin, 1943). Basic physical requirements of the school building like minimum standards for classroom size, acoustics, lighting, heating and air conditioning, in addition to pedagogical, psychological and social variables act together as a whole in shaping the context within which learning takes place (Lackney, 1999). Therefore, educational environmental include social, organizational, and physical environments: i.
6. Teaching Environment
A study by Tam and Cheng (1995; measured the internal social environment of the school organization and its relations to the performance of teachers and students.
School environment and performance of students did have theoretical and Global Journal of Management 2 2012 ear practical implications in school management. Leadership has been found to be an important factor in the maintenance of a cohesive social environment for the teachers to work in. A minimum period of time required for leadership effects to take root (Ming & Cheong, 1995;Cheng, 1993). Additional factors that reflect learning/teaching environment, were labeled: strength of leadership, staff frustration, positive classroom climate, caring and support to students (a combination of three environment variables: esprit, intimacy, and student-centeredness), formalization, and pupil control (pupil control ideology minus organizational ideology) (Ming, 1994;Ming & Cheong, 1995).
Leadership factor was measured by the integration of the five aspects: instructional (educational), structural (hierarchy of authority, hindrance (difficulty and obstruction) as signs of bureaucratization of a school, and participative decision), human resource, political, and cultural (symbolic) (Sergiovanni;1984;Bush, 1986;Bolman & Deal, 1991;Cheng, 1993). Personal characteristics of the students included age and gender. Personal characteristics of the teacher included average teacher teaching experience of the school (teaching age), age of the teacher, and gender of the teacher. Teacher performance was measured by efficacy and time-use at the individual level.
Students' performance was measured by learning efficacy (efficiency). Students' competition was a function of affiliation and involvement, better social relationship among students increase students' engagement in studying (Ming, 1994;Ming & Cheong, 1995).
ii. School Environment i.) Schools Size: Small schools benefit students socially and academically, while smaller school buildings consume less energy. Additionally, small schools serve as true community centers. The use of school facilities can be shared with a variety of community organizations fostering meaningful partnerships civic participation and engagement, as well as opportunities for children to walk and bike with the added public health benefit of increasing their physical activity (Lackney, 1999). On average, the research indicates that an effective size for an elementary school is in the range of 300-400 students and that 400-800 students is appropriate for a secondary school (7-8) (Cotton, 1996). Further, school size affects the following: ii.) Academic Achievement: (Burke, 1987 iii.) Quality of the Curriculum: Howley (1994Howley ( , 1996) ) revealed that there is no reliable relationship between school size and curriculum quality. In terms of instructional approaches and strategies, teachers in small schools are more likely to form teaching teams, integrate their subject matter content, employ grouping and cooperative learning, and use alternative assessments (Raze, 1985;Rutter, 1988;Walberg, 1992). iv.) Cost-Effectiveness: The relationship between size and costs varies depending on school circumstances (Robertson, 1995;Rogers 1987). v.) Student Attitudes: Studies by Aptekar (1983) and Bates (1993) Some researchers found a greater sense of among students in small schools than in large ones (Burke, 1987;Campbell et al., 1981;Fowler & Walberg, 1991;Gregory, 1992;Howley, 1994;Pittman and Haughwout, 1987;Stolp, 1995;Walberg, 1992). xi.) Self-Concept: Grabe (1981), Rutter (1988), and Stockard and Mayberry (1992) have found that both personal and academic self-regard are more positive in smaller schools.
7. xii.) Interpersonal Relations:
There are positive correlations between small schools and favorable interpersonal relations among students and between students and teachers (Bates, 1993;Burke, 1987;Fowler & Walberg, 1991;Gottfredson, 1985;Gregory & Smith, 1982;1983 readiness and the relative merits of large and small schools college-related variables such as entrance examination scores, acceptance rates, attendance, grade point average, and completion found small schools equal (Fowler, 1992;Jewell, 1989) or superior (Burke, 1987;Swanson, 1988) to large ones in their capacity to prepare students for college entrance and success.
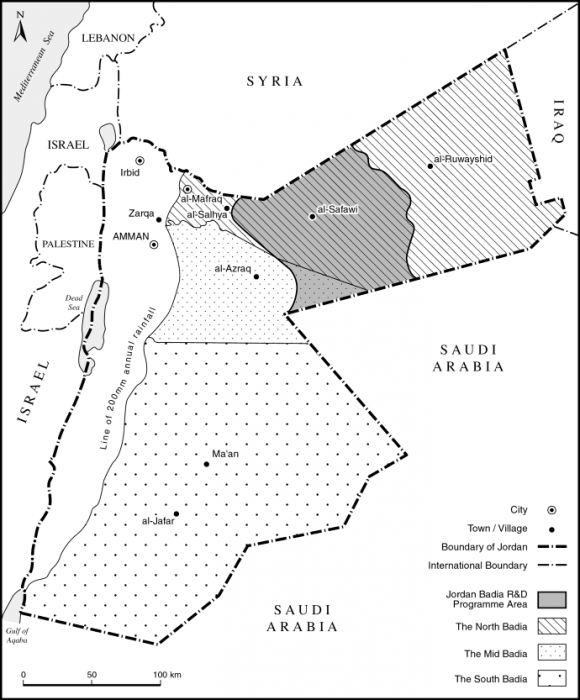
f) Research Setting Demographics Mafraq Governorate area is about 26435 Square kilometers, which represents about 29.6% out of Jordan's total area, and the second largest governorate after Ma'an. The governorate has four regions that include (Department of Statistics, 2001): (1) Mafraq center with 104,000 with 3 districts and 72 settlements of which 25 increases over 1000 people, (2) Northwest Badia and its center is al Al Al-Bayt University and have three districts with 71,000 population and 42 settlements eight of which increases over 1000 people, (3) Northeast Badia, Safawi is its center, and have four districts with 51,000 population and 67 settlements with 10 settlements that have more than 1000 population, and (4) Ruwaished is its center with population of 17,000 and twelve settlements, four of which its populated with more than 1000 (Department of Statistics, 2002). The governorate has 18 municipalities that lack services and facilities for its local residents. These municipalities include: (1) Greater Mafraq, ( 2 One of the major problems the governorate suffer from is the disperse location of human settlements and of natural resources, which make the provision of infrastructure and services very costly. Road infrastructure represents 15% from the total of Jordan. 98% of the population is provided with water, electricity, and phone lines. Daily water use is rated 229 liters/person. Water loss is 73% of Jordan's total. In 2000 Mafraq governorate share was 1.8%, Gasoline is 3.5%, and diesel is 4.4% out of Jordan's total. Tourism activities are limited if not rare. The natural resources of the governorate are underground water, natural gas, and basalt zeolite. Average hospital beds are 10.8 for each 10000 compared to 16 in Jordan. Infants' hospital birth is 6.4% of Jordan's total infants born in hospitals. Disease like Zuhar Ameybi is 58.7%, malti fever is 55%, lung disease is 12.7%, and lever disease is 10.3% of Jordan's total. Most of those who use health centers have military insurance (Department of Statistics, 2002).
There are three directorates in Mafraq Governorate: Mafraq Center, Northeast Badia, and Northwest Badia. Infiltration may be for premature marriage, financial and living conditions and some students and their families, and lack of transportation. The latest statistics shows that Mafraq Governorate have about 353 schools, of which 337 built by the Ministry of Education, one by the Military, One by the Ministry of Social development, two by UNRWA, eight by private sector, in addition to three private sector kindergartens. Statistics show that there is total of 35562 male students, 32924 female students, 1989 male teachers, and 2416 female teachers, distributed over the North Badia Directorate schools. About 4206 teachers attend these schools 55% of which are females. There are 60 schools that are partially or totally rented. 30 Mafraq Govenerate succeeded in providing most eligible children with educational opportunities, thus narrowing gender, rural, and socioeconomic gaps in access to schooling. This has led to strains resulting from the maintenance costs of the established education apparatus; new demands for instruction at post-compulsory levels of education; and the consequent costs of ongoing inefficiencies: dropouts, low graduate employment, and ambivalent learning outcomes.
How much of this outcome is the consequence of particular characteristics of the education systems and how much is due to weak linkages between education and labor markets?
g) Conceptual FrameworkFrom the previous review the following framework can be concluded: i. Investment in education is translated into higher economic growth and investment returns, improved income equality, and lower poverty. It is reflected in measures like available supply, incentives of supply, demand, and market failures. However, investment in education is challenged by globalization and knowledge, economy, demographic pressure, finance of education, pedagogical reforms, and education and migration. ii. Education is a value chain that requires context understanding. Market challenges and university education includes co-operation with the market, privatization of higher education, marketing higher education, and marketing in higher education. iii. Demand of the educational environment in the value chain is reflected in indications like opportunities of jobs and economic activities, training, and limitations of demand. iv. Supply of the educational environment in the value chain includes the teaching-organizational, physical entities, and capacity of quality and quantity of supply, in addition to personality issues of the teacher and the student.
8. h) Hypotheses of the Study
Based on the above review and the assumption that Higher Education in Mafraq Governorate lacks supply of applied sciences majors (such as agriculture, engineering, architecture, nursery, medicine, arid land development, and resources management) at the local university level, it is hypothesized that there is a demand for higher education majors by the local community.
Further, students lack competitiveness because they lack preparedness at the school level. Lack of preparedness is affected by lack of capacity in quantity and quality of the supply of the Teaching Environment and as follows:
1) Lack of preparedness is affected by lack of capacity in quantity of supply -number of sections and students. 2) Lack of preparedness is affected by lack of capacity in quantity of supply -number and specialties of teachers. 3) Lack of preparedness is affected by the capacity of the quality of the teaching environment -teachingorganizational entity of the school environment.
The hypotheses of the study were investigated based on field research using surveys. One leader for two teams of eight assistants conducted the field research. The total number of sample frame is 337 schools of which 231 for elementary education, and 96 secondary, 8 vocational and academic, and two vocational. The proportion is suggested to be about 60%-70% of the schools distributed over the three directorates and covering all the municipalities. So from each municipality only two-thirds of the total available schools were suggested to be interviewed from both female and male elementary and secondary schools. Randomization used the list of schools in each municipality which is alphabetically ordered. Selection was assigned randomly as every other school in the list until the proportion of 60-70% of the schools is achieved from each of the female and male elementary and secondary schools list. Training workshops that municipals received included training in: management (10.9%), pedagogy (2.6%), computer skills (5.7%), and specialized training (0.4%), see Tables 1 & 2. In terms of years of service for the interviewed municipals: less than five years of service (33.2%), 6-10 years (24.9%), 11-15 years (11.4%), 16-20 years (12.7%), 21-15 years 10%, and more than 25 years (7.8%). About 50% of the subjects served 6-10 years, see Table 2.
More than half of the sample comes from the same town they work at (55.5%); about 40.6% come from other villages in the North Badia regions, and only about 3.9% come from outside the North Badia Region, see Tables 1 & 2.
ii.
9. Descriptive Statistics of the Major Study Variables a. Capacity of Physical Entity of Educational Supply
Capacity of the physical entity of the education supply includes: (1) Classroom environment: proper classroom size in terms of students numbers, classroom area, classroom size in terms of students numbers, classroom shape, classroom seats arrangement, classroom's furniture arrangement flexibility, attention to furniture and equipment so teachers can store their tools, natural and additional lighting sources, thermal conditions, air quality and natural ventilation; and (2) School environment: availability of services such as computer labs, science labs, art studios, school library, indoor and outdoor sports facility, food facility, praying facility, school fencing, school gate, rest rooms, school size in terms of students numbers, school area, school quite location/noise location, and building maintenance. 1) Classroom Environment : In terms of classroom area, it ranged from 4-48 square meters. However, most of the sample (73.7%) has classroom area of 10-29 square meters. In regards to classroom size in terms of students' numbers, the number of students ranged from 2 to 50 students, with an average size of about 21 students. About half the sampled schools (52.8%) have classroom size of less than 20 students.
In regards to proper classroom size in terms of students' numbers, most of the sample agreed on its appropriateness (71.2%).
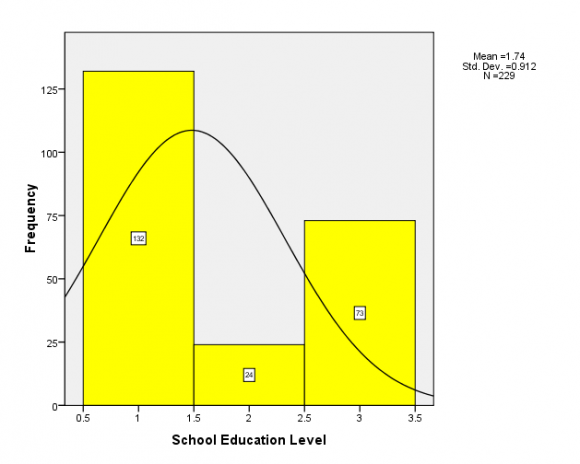
Classroom shapes were square, rectangular, and irregular. However, the most occurring shape is rectangular (58.5%) and the least is irregular (2.6%). In terms of classroom seats arrangement, most of the sample (85.6%) agreed on its appropriateness. Also, about 54.2% of the and Business Research Volume XII Issue XIV Version I sample agreed on classroom's furniture arrangement flexibility. Further, most of the sample (72.5%) considered the attention to furniture and equipment so teachers can store their tools is appropriate. In terms of natural lighting sources, most of the sample agreed on its availability (90.8%). Number of windows in classrooms ranged from 1-8, the most frequent occurrence of number of windows is two (48.5%) indicated so. In terms of additional lighting sources, about two-thirds of the sample (79.5%) agreed on its presence. Thermal conditions: only about half the sample agreed on its heat availability (47.2%) and on about one-quarter (26.2%) agreed on its cooling control. In regards to air quality and natural ventilation, most of the sample (87.3%) agreed on its availability in classrooms. The education level across the sampled schools was as follows: about 57.64% of schools were elementary, 10.48% secondary, and 31.88% have all levels, see Figure 3. In terms of distribution of students sections, students' numbers, pass, and fail across of the sample, results showed the following: 1. 1 st grade -for the 115 schools who responded, sections ranged from 1-10, students numbers in these sections ranged from 5-165, and failing students ranged from 0-2. 2. 2 nd grade -for the 117 schools who responded, sections ranged from 1-3, students numbers in these sections ranged from 1-91, and failing students ranged from 0-1. 3. 3 rd grade -for the 140 schools who responded, sections ranged from 1-4, students numbers in these sections ranged from 1-80, and failing students ranged from 0-4 . 4. 5 th grade -for the 153 schools who responded, sections ranged from 1-3, students numbers in these sections ranged from 1-101, and failing students ranged from 0-3. 5. 6 th grade -for the 146 schools who responded, sections ranged from 1-3, students numbers in these sections ranged from 1-102, and failing students ranged from 0-2. 6. 7 th grade -for the 140 schools who responded, sections ranged from 1-3, students numbers in these sections ranged from 1-121, and failing students ranged from 0-11. 7. 8 th grade -for the 130 schools who responded, sections ranged from 1-4, students numbers in these sections ranged from 2-145, and failing students ranged from 0-4. 8. 9 th grade -for the 122 schools who responded, sections ranged from 1-4, students numbers in these sections ranged from 2-137, and failing students ranged from 0-7.
9. 10 th grade -for the 111 schools who responded, sections ranged from 1-4, students numbers in these sections ranged from 2-137, and failing students ranged from 0-5.
10. Eleventh Grade Stage
In terms of distribution of students sections, students' numbers, pass, and fail across of the sample, results showed the following: 1. 11 th grade/scientific -for the 48 schools who responded, sections ranged from 1-3, students numbers in these sections ranged from 1-124, and failing students ranged from 0-1. 2. 11 th grade/literature -for the 81 schools who responded, sections ranged from 1-2, students numbers in these sections ranged from 3-60, and failing students ranged from 0-10. 3. 11 th grade/computer -for the 12 schools who responded, sections ranged from 1-2, students numbers in these sections ranged from 14-89, and failing students were none. 4. 11 th grade/nursing -for the two schools who responded, sections were 1, students numbers in these sections ranged from 7-24, and failing students were none. 5. 11 th grade/trade -for the one school who responded, sections were one, students numbers in the section was 18, and failing students were none. 6. 11 th grade/industrial -for the one school who responded, but subject did not provide additional information about students' numbers and number of failing students. 7. 11 th grade/agricultural -for the one school who responded, sections were 1, students numbers in the section was 37, and failing students were none.
Global Journal of Management 2 2012 ear 8. 11 th grade/management -for the one school who responded, sections were 1, students numbers in the section was 3, and failing students were none. 9. 11 th grade/vocational -for the four schools who responded, sections were 1-2, students numbers in these sections ranged from 14-31, and failing students were none. 10. 11 th grade/beauty -for the one school who responded, sections were 1, students numbers in the section was 12, and failing students were none.
Twelfth Grade Stage (Tawjeehi)
In terms of distribution of students sections, students' numbers, pass, and fail across of the sample, results showed the following: 1. 12 th grade/scientific -for the 38 schools who responded, sections ranged from 1-4, students numbers in these sections ranged from 3-124, and failing students ranged from 0-15. 2. 12 th grade/literature -for the 73 schools who responded, sections ranged from 1-2, students numbers in these sections ranged from 3-55, and failing students ranged from 0-26. 3. 12 th grade/computer -for the 12 schools who responded, sections ranged from 1-2, students numbers in these sections ranged from 15-92, and failing students were 0-2. 4. 12 th grade/nursing -for the three schools who responded, sections were 1, students numbers in these sections ranged from 9-25, and failing students were 0-3. 5. 12 th grade/trade -for the one school who responded, sections were one, students numbers in the section was 20, and failing students were 14. 6. 12 th grade/industrial -no school from the sample has industrial at this level. 7. 12 th grade/agricultural -for the one school who responded, sections were 1, students numbers in the section was 26, and failing students were none. 8. 12 th grade/management -for the one school who responded, sections were 1, students numbers in the section was 6, and failing students were none. 9. 12 th grade/vocational -for the three schools who responded, sections were 1-2, students numbers in these sections ranged from 15-25, and failing students were none. 10. 12 th grade/beauty -for the one school who responded, sections were 1, students numbers in the section was 12, and failing students were none.
2) Available Teachers -Distribution across Majors, Age, Specialty, Teaching Experience (years of Service), and Teaching Efficacy and Hours of Teaching (Teaching Load Measured in Hours), Training Workshops, and Place of Residence: 1. Religion Teachers : ranged from 0-6 with a total number of 210 and an age of 20 and above, served 0-24 years with an average of 7.7 years, taught 0-61 hours with an average of 21.2 hours a week, trained with an average of 2-3 workshops, and resided mostly in the North Badia region. 2. Arabic Teachers : ranged from 0-7 with a total number of 209 and an age of 20 and above, served 0-30 years with an average of 9.4 years, taught 0-123 hours with an average of 24.2 hours a week, trained with an average of 3-4 workshops, and resided mostly in the North Badia region. 3. English Teachers : ranged from 1-6 with a total number of 214 and an age of 20 and above, who has education of College to Bachelor degree, and served 0-25 years with an average of 7.1 years, taught 0-87 hours with an average of 22.8 hours a week, trained with an average of 3 workshops, and resided mostly in the North Badia region. 4. Culture Teachers : ranged from 0-3 with a total number of 204 schools and an age of 20-50, who has education of College to Ph.D. degree, and served 0-19 years with an average of 6.3 years, taught 0-25 hours with an average of 17.0 hours a week, trained with an average of 2-3 workshops, and resided mostly in the North Badia region. 5. Math Teachers : ranged from 0-6 with a total number of 203 schools and an age of 20 and above, who has education of College to Ph.D. degree, and served 0-30 years with an average of 7.1 years, taught 0-79 hours with an average of 22.1 hours a week, trained with an average of 2-3 workshops, and resided mostly in the North Badia region. 6. Science Teachers : ranged from 0-6 with a total number of 191 schools and an age of 20 and above, who has education of College to Masters degree, and served 0-22 years with an average of 7.4 years, taught 0-42 hours with an average of 20.2 hours a week, trained with an average of 3-4 workshops, and resided mostly in the North Badia region. 7. Physics Teachers : ranged from 0-3 with a total number of 159 schools and an age of 20-50, who has education of Bachelor to Masters degree, and served 0-16 years with an average of 5.2 years, taught 0-32 hours with an average of 18.8 hours a week, trained with an average of 1-2 workshops, and resided mostly in the North Badia region. 8. Chemistry Teachers : ranged from 0-2 with a total number of 142 schools and an age of 20 and above, who has education of Bachelor to Ph.D. degree, and served 0-16 years with an average of 4.6 years, taught 0-24 hours with an average of 17.8 hours a week, trained with an average of 1-2 workshops, and resided mostly in the North Badia region. 9. Biology Teachers : ranged from 0-2 with a total number of 138 schools and an age of 20 and above, who has education of Bachelor to Ph.D. Year degree, and served 0-26 years with an average of 6.5 years, taught 0-24 hours with an average of 16.7 hours a week, trained with an average of 1-2 workshops, and reside dmostly in the North Badia region. 10. Geology Teachers : ranged from 0-2 with a total number of133 schools and an age of 20-40, who has education of Bachelor to Masters degree, and served 1-15 years with an average of 5.0 years, taught 7-21 hours with an average of 16.1 hours a week, trained with an average of 2-3 workshops, and resided mostly in the North Badia region. 11. Computer Teachers : ranged from 0-8 with a total number of 161 schools and an age of 20 and above, who has education of College to Masters degree, and served 0-17 years with an average of 4.0 years, taught 0-38 hours with an average of 15.6 hours a week, trained with an average of 2-3 workshops, and resided mostly in the North Badia region. 12. Geography Teachers : ranged from 0-6 with a total number of 164 schools and an age of 20 and above, who has education of College to Masters degree, and served 0-17 years with an average of 5.7 years, taught 0-28 hours with an average of 19.1 hours a week, trained with an average of 2-3 workshops, and resided mostly in the North Badia region. 13. History Teachers: ranged from 0-3 with a total number of 151 schools and an age of 20-50, who has education of College to Masters degree, and served 0-20 years with an average of 7.1 years, taught 0-27 hours with an average of 17.7 hours a week, trained with an average of 3-4 workshops, and resided mostly in the North Badia region. 14. Arts Teachers: ranged from 0-6 with a total number of 131 schools and an age of 20-50, who has education of College to Masters degree, and served 2-16 years with an average of 8.3 years, taught 7-103 hours with an average of 19.4 hours a week, trained with an average of 2-3 workshops, and resided mostly in the North Badia region. 15. Athletics Teachers : ranged from 0-6 with a total number of 129 schools and an age of 20-50, who has education of College to Masters degree, and served 0-20 years with an average of 7.0 years, taught 0-28 hours with an average of 18.4 hours a week, trained with an average of 2-3 workshops, and resided mostly in the North Badia region.. 16. Music Teachers : ranged from 0-1 with a total number of 61 schools and an age of 20-40, who has education of Bachelor to Ph.D. degree, and served 0-15 years with an average of 5.5 years, taught 0-21 hours with an average of 14.8 hours a week, trained with an average of 2-3 workshops, and resided mostly in the North Badia region. 17. Languages Teachers s: ranged from 0-8 with a total number of 69 schools and an age of 20-50, who has education of Bachelor to Masters degree, and served 0-21 years with an average of 6.8 years, taught 1-28 hours with an average of 21.4 hours a week, trained with an average of 5-6 workshops, and resided mostly in the North Badia region.
c. Capacity of Teaching-Organizational Entity of the Supply & Capacity of Quality of Education Supply at the School Level & Other Variables Capacity of Teaching-Organizational Entity of the Supply : Instructional capacity was assessed with an average of 4 and a tendency of strong agreement; structural agreement was also with an average of 4.1 and a tendency of strong agreement; staff frustration has a tendency of disproval with an average of 2.6; positive classroom environment has a slight tendency of approval with an average of 3.7; caring and support for students has a slight tendency of approval with an average of 4; formalization has a tendency of strong agreement with an average of 4.2; and students control has a strong agreement with an average of 4.2, see Table 3.
Capacity of Quality of Education Supply at the School Level: Perception of existing pedagogy has a slight tendency of approval with an average of 3.8; directing students to choose the right stream also received slight approval with an average of 3.5; and obstacles of Ministry of Education concentration has a tendency of agreement with an average of 4.0, see Table 3.
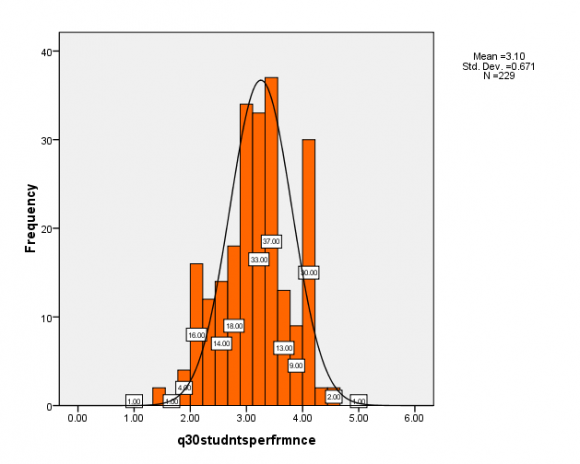
Other Variables: Included students attitude with a tendency of slight agreement (M=3.8); teachers attitude with tendency of agreement (M=3.98); available school services has a slight agreement with M=3.4; and perceived students' performance has a tendency of slight agreement (M=3.1), see Table 3. Over all perceived students' performance averaged 3.1, with a slight agreement, see Figure 4. The test of effect of overall performance by capacity of quantity of Education Supply at the Eleventh Grade stage using Anova Test of Variance (Table 6) indicated significant effect of sections at Eleventh Grade Scientific, Computer and Nursing streams. As well, as significant effect of Number of students at Eleventh Grade Scientific and Computer streams.
The test of effect of overall performance by capacity of quantity of Education Supply at the Twelfth Grade stage using Anova Test of Variance ( However, factors that could contribute to the regression model in the order of their strong effect are: number of students at Eleventh Grade Computer stream, Twelfth Grade Scientific stream, and Twelfth Grade Computer stream, see Table 10.
11. iii. Regression Model for the Significant Teachers Inputs Effect of Overall Students Performance
The hypothesis that Overall Student Performance is affected by a set of Teachers Inputs was reported significant, see Table 11. Capacity of quality of education Supply at the school level: perception of existing pedagogy has a slight tendency of approval; directing students to choose the right stream also received slight approval; and obstacles of Ministry of Education concentration has a tendency of agreement. In terms of capacity of teaching-organizational entity of the supply, instructional capacity was assessed with a tendency of strong agreement; structural agreement was also with a tendency of strong agreement; staff frustration has a tendency of disproval; positive classroom environment has a slight tendency of approval; caring and support for students has a slight tendency of approval; formalization has a tendency of strong agreement; and students control has a strong agreement. Additionally, students' attitude has a tendency of slight agreement; teachers' attitude has tendency of agreement; available school services has a slight agreement; and perceived students' performance has a tendency of slight agreement. In terms of capacity of quantity of Education Supply at the Elementary level effect on Perceived overall performance, results indicated that attributes of effect at the elementary stage level include: numbers of sections at Second, Third, Fifth, Sixth, Seventh, Eighth, Ninth, and Tenth Grades.
12. Global Journal of Management and Business Research Volume XII Issue XIV Version I
In terms of capacity of quantity of Education Supply at the Eleventh Grade level effect on Perceived overall performance, results indicated that attributes of effect at the Eleventh Grade level include: sections of Scientific, Computer and Nursing streams; as well as, number of students at Scientific and Computer streams. In terms of capacity of quantity of Education Supply at the Twelfth Grade level effect on Perceived overall performance, results indicated that attributes of effect at the Twelfth Grade level include: sections of Nursing streams; as well as, number of students of Scientific and Computer streams.
In terms of capacity of number of teachers on Perceived overall performance, results indicated that attributes of effect number of teachers include the following majors: Religion, Arabic, English, Math, Physics, Biology, Geology, Computer, History, and Languages teachers.
Overall Student Performance is affected by a set of attributes of Capacity of Students Quantity inputs was not significant.
However, factors that could contribute to the regression model in the order of their strong effect are: number of students at Eleventh grade Computer stream, and Twelfth Grade Scientific and Computer streams.
Overall Student Performance is affected by a set of attributes of Capacity of Teachers Quantity inputs was significant. However, factors that contributed to the regression model in the order of their strong effect are: feel upgrading is not made possible, especially for schools who have rented buildings. 11. Electronic Infrastructure: Most schools have it available but some lack its availability. Some municipals indicated their need for simple computer infrastructure; and others suffer from lack of computer systems at their schools.
b. Quality Assessment:
1. Existing Pedagogy: it is a foreign system on Arab students; it is applied without consideration for its appropriateness for the region; some contents are V.
13. Conclusions
Global This suggests working more on enhancing the teachers' attitude, as their qualifications seem sufficient but they lack inspiration and incentives and it seems to be a worthwhile issue of investment by policy maker of higher education. 4. Physical infrastructure that supports students' activity seems vital and affects student's performance positively. Therefore, it is worth to invest in sports and arts facilities, and the like.
However, the following partners should play different roles:
1. Policy makers: should not be mainly concerned about the inputs of schooling (finance, curriculum, and student allocation), but should also pay attentions about the internal process of the school, such as instructional approaches, school structure, etc. 2. School administrators: the school environment may be related to the contextual factors of the schools, such as age, size, experience of the teachers, etc., which is not under the control of the school administrators, but they have the authority to plan and implement suitable policies which can reduce the negative effects of the school contextual factors. Another implication is for the school administrators to keep in mind that although the school environment is complicated, the different aspects of school environment are inter-related, and they need to take a holistic view about school environment, and that school management should not be conducted in a piecemeal fashion. 3. Education Department: since the principal is in a key role in the creation of a good school environment, which would be beneficial to the learning of the students and the success of the teachers, it implies that selection and training of principal should be given prominent attention by the policy makers and Education Department. The stability of leadership effect implies that in order for the leadership effects of principals to take root, the incumbents should not change too often.
14. 4.
Training programs: because a principal has multiple roles, he/she is an educational leader, a structural leader, a human relationship leader, a political leader, and a symbolic leader; it suggests that training programs for the principal should include the following five components.
15. e) Limitations of the Research Study
The research aperwork was long and even when released was not enough to convince the local municipals to collaborate with the extensive data related to teachers and students inputs (especially scores of students in all subjects and at all level). Further, teachers at the interviewed schools offered no time to work with or help the research team in extracting this data. In addition at the central exam office of the Ministry this data, which was supposed to be upload to EduWave, were not accessible or available. In terms of questionnaire, it was long, for future studies components of the research will be separated in different parcels and phases. Finally, the timing of the research was towards the end of the academic year; many schools where dropped out from the study because they were on vacation.
16. Year
Students, Teachers, and Organizational Capacities' Impact on Overall Students Performance in Mafraq Governorate
17. d) Implication
Major issues that should be considered by education policy makers include: 1. To restructure inputs of education in the Northeast Badia Region. 2. Emphasis of joining schools together, as it seems number of students as well as section are vital for output and more so than number of teachers. Many schools are suffering, especially in the Northeast Badia Region, from small number of students in geographically dispersed villages. It is healthier to

| Global Journal of Management |
| Frequency | Percent | Cumulative Percent | |
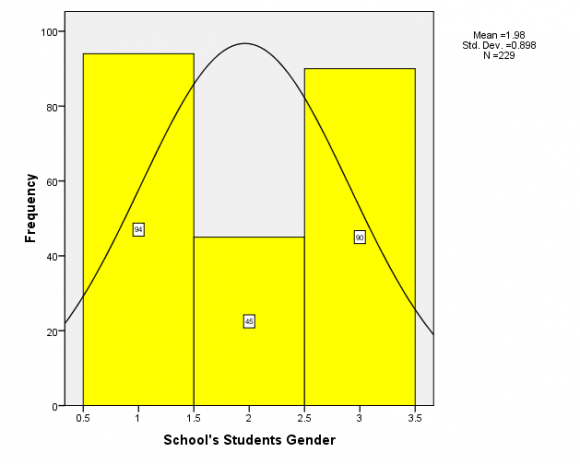
| Gender | |||
| Male | 104 | 45.4 | 45.4 |
| Female | 125 | 54.6 | 100.0 |
| IV. | Results And Analysis | Global Journal of Management and Business Research Volume XII Issue XIV Version I |
| However, about 61.1% of the sample has schools of |
| less than 150 students, and the most occurring |
| number of students at sampled schools is 150-200 |
| students (about 40.7%). School area ranged from |
| 54-10000 square meters, with the most occurring |
| area of 200-500 square meters (39.9%). About half |
| the sample (48%) has area of less than 500 square |
| meters. Further, 79% of the sample agreed on the |
| schools being located in a quite zone and away |
| from noise. In terms of building maintenance, about |
| half of the sample (54.6%) agreed it is well |
| maintained. |
| b. Capacity of Quantity of Educational Supply |
| Global Journal of Management | Supply & Other Variables | |||||
| N Range Minimum Maximum Mean | Std. | Variance | ||||
| Deviation | ||||||
| Teaching-Organizational Entity | ||||||
| Instructional | 229 2.40 | 2.60 | 5.00 | 4.0170 | .38732 | .150 |
| Efficacy -Education Outputs | |||||||
| N | Range | Minimum | Maximum | Mean | Std. | Variance | |
| Deviation | |||||||
| Overall Performance | 229 | 3.10 | 0.670 | ||||
| High Performance in Science | 229 | 4 | 1 | 5 | 3.23 | 1.023 | 1.047 |
| High Performance in Math | 229 | 4 | 1 | 5 | 2.85 | 1.066 | 1.136 |
| High Performance in Physics | 229 | 4 | 1 | 5 | 2.71 | 0.896 | 0.803 |
| High Performance in Chemistry | 229 | 4 | 1 | 5 | 2.87 | 0.918 | 0.842 |
| High Performance in Biology | 229 | 4 | 1 | 5 | 3.13 | 0.923 | 0.851 |
| High Performance in Geology | 229 | 4 | 1 | 5 | 3.18 | 0.907 | 0.823 |
| High Performance in Computer Science | 229 | 4 | 1 | 5 | 3.39 | 0.854 | 0.730 |
| High Performance in Arabic | 229 | 4 | 1 | 5 | 3.67 | 0.835 | 0.696 |
| High Performance in English | 229 | 4 | 1 | 5 | 2.88 | 1.077 | 1.160 |
| students have high performance in English, | |||||||
| accumulative percent = 50.7%. | |||||||
| 1. Science, about one-third of the sample does not agree that students have high performance in science, accumulative percent = 34.5%. 2. Math, about half of the sample does not agree that students have high performance in Math, accumulative percent = 51.1%. 3. Physics, about half of the sample does not agree that students have high performance in Physics, accumulative percent = 44.1%. | b) Relationship between Overall Students Performance and Capacity of Students & Teachers Quantity (Inputs) In order to test the hypothesis that lack of preparedness is affected by lack of capacity in quantity of the supply of the Teaching Environment (Students and Teachers), the following statistical Multi-level Analysis were carried out. | ||||||
| 4. Chemistry, about one-third of the sample does not agree that students have high performance in Chemistry, accumulative percent = 37.6%, 5. Biology, about one-quarter of the sample does not agree that students have high performance in Biology, accumulative percent = 24.9%. 6. Geology, about one-fifth of the sample does not agree that students have high performance in Geology, accumulative percent = 22.7%. 7. Computer Science, about one-fifth of the sample | i. ANOVA Test -Effect of Overall Perceived Performance by Quantitative Inputs of Supply Further analysis was carried out to investigate the effect of capacity of quantity of Education Supply of students on Overall Perceived Performance using anova test. a. Overall Performance Affect by Quantitative Inputs of Elementary Stage Supply (numbers of sections and students) | ||||||
| does not agree that students have high | |||||||
| performance in Computer Science, accumulative | |||||||
| percent = 17.0%. | |||||||
| 8. Arabic, most of the sample agree that students | |||||||
| have high performance in Arabic, accumulative | |||||||
| percent = 76.9%. | |||||||
| 9. English, about half of the sample do not agree that | |||||||
| Global Journal of Management | Students Input/Capacity of Quantity of Supply Sum of Squares df Mean Square | F | Sig. | ||
| 1 st Grade No. of Sections | 48.427 | 29 | 1.670 | 1.273 | .171 |
| 1 st Grade No. of Students | 9740.228 | 22 | 442.738 | .631 | .891 |
| 2 nd Grade No. of Sections | 31.387 | 29 | 1.082 | 1.716 | .017 |
| 2 nd Grade No. of Students | 6261.028 | 23 | 272.219 | .608 | .913 |
| 3 rd Grade No. of Sections | 27.528 | 29 | .949 | 1.607 | .032 |
| Sum of Squares | df | Mean Square | F | Sig. | |
| Scientific/11 th Grade No. of Sections | 9.636 | 29 | .332 | 1.550 | .044 |
| Scientific/11 th Grade No. of Students | 14206.063 | 17 | 835.651 | 9.937 | .000 |
| Literature/11 th Grade No. of Sections | 9.818 | 29 | .339 | 1.315 | .141 |
| Literature/11 th Grade No. of Students | 1666.720 | 26 | 64.105 | .602 | .920 |
| Computer/11 th Grade No. of Sections | 3.807 | 29 | .131 | 1.640 | .027 |
| Computer/11 th Grade No. of Students | 4278.000 | 8 | 534.750 | 46.276 | .005 |
| Nursing/11 th Grade No. of Sections | 1.253 | 29 | .043 | 2.363 | .000 |
| Nursing/11 th Grade No. of Students | 144.500 | 1 | 144.500 | . | . |
| Trade/11 th Grade No. of Sections | .130 | 29 | .004 | .482 | .989 |
| Industrial/11 th Grade No. of Sections | .096 | 29 | .003 | .729 | .843 |
| Agricultural/11 th Grade No. of Sections | .067 | 29 | .002 | .496 | .987 |
| Management/11 th Grade No. of Sections | .180 | 29 | .006 | .444 | .994 |
| Vocational/11 th Grade No. of Sections | 1.276 | 29 | .044 | 1.334 | .130 |
| Vocational/11 th Grade No. of Students | 182.000 | 3 | 60.667 | . | . |
| Beauty/11 th Grade No. of Sections | .120 | 29 | .004 | .440 | .995 |
| Sum of Squares | df | Mean Square | F | Sig. | |
| Scientific/12 th Grade No. of Sections | 10.016 | 29 | .345 | 1.510 | .054 |
| indicated significant effect of sections at Twelfth Grade |
| Nursing streams. As well, as significant effect of |
| Number of students at Twelfth Grade Scientific and |
| Computer streams. |
| ) |
| 2012 | |||||||||
| ear Y | |||||||||
| 2 102 | |||||||||
| Sum of Squares | df | Mean Square | F | Sig. | |||||
| Religion Number of Teachers | 47.422 | 29 | 1.635 | 2.125 | .001 | ||||
| Arabic Number of Teachers | 102.591 | 29 | 3.538 | 1.923 | .005 | ||||
| English Number of Teachers | 57.413 | 29 | 1.980 | 1.572 | .039 | ||||
| Culture Number of Teachers | 6.302 | 29 | .217 | .772 | .793 | ||||
| Math Number of Teachers | 68.258 | 29 | 2.354 | 1.926 | .005 | ||||
| Science Number of Teachers | 33.406 | 29 | 1.152 | 1.147 | .286 | ||||
| Physics Number of Teachers | 15.723 | 29 | .542 | 1.607 | .032 | ||||
| Global Journal of Management | Chemistry Number of Teachers Biology Number of Teachers Geology Number of Teachers Computer Number of Teachers Geography Number of Teachers History Number of Teachers Arts Number of Teachers Athleticss Number of Teachers Music Number of Teachers | 11.893 14.496 7.618 33.820 18.537 16.820 9.538 10.169 .416 | 29 29 29 29 29 29 29 29 29 | .410 .500 .263 1.166 .639 .580 .329 .351 .014 | 1.524 2.079 1.864 1.542 1.477 1.910 .986 .821 .526 | .050 .002 .007 .046 .064 .005 .492 .730 .979 | |||
| Languages Number of Teachers | 130.636 | 29 | 4.505 | 2.251 | .001 | ||||
| ii. Regression Model for the Significant Students | |||||||||
| Inputs Effect of Overall Students Performance | |||||||||
| The | hypothesis | that | Overall | Student | |||||
| Performance is affected by a set of Students Inputs was | |||||||||
| reported none significant in | |||||||||
| Effect Wilks' Lambda | Value | F | Hypothesis df | Error df | Sig. |
| Intercept | .088 | 3.444 | 3.000 | 1.000 | .373 |
| Perceived Students Performance -Overall Learning | .041 | .386 | 18.000 | 3.314 | .920 |
| Efficacy |
| over Significant Variables |
| Effect Wilks' Lambda | Value | F | Hypothesis df | Error df | Sig. |
| Intercept | .376 | 26.042 | 12.000 | 188.000 | .000 |
| Perceived Students Performance -Learning Efficacy | .139 | 1.190 | 348.000 | 2128.068 | .014 |
| Students, Teachers, and Organizational Capacities' Impact on Overall Students Performance in Mafraq | ||||||
| Governorate | ||||||
| Source | Dependent Variable | Type III Sum of | df | Mean Square | F | Sig. |
| Squares | ||||||
| Corrected Model | Religion Number of Teachers | 47.422 | 29 | 1.635 | 2.125 | .001 |
| Arabic Number of Teachers | 102.591 | 29 | 3.538 | 1.923 | .005 | |
| English Number of Teachers | 57.413 | 29 | 1.980 | 1.572 | .039 | |
| Math Number of Teachers | 68.258 | 29 | 2.354 | 1.926 | .005 | |
| 2012 | Physics Number of Teachers Chemistry Number of Teachers | 15.723 11.893 | 29 29 | .542 .410 | 1.607 1.524 | .032 .050 |
| ear Y | Biology Number of Teachers Geology Number of Teachers | 14.496 7.618 | 29 29 | .500 .263 | 2.079 1.864 | .002 .007 |
| 2 104 | Computer Number of Teachers Geography Number of Teachers | 33.820 18.537 | 29 29 | 1.166 .639 | 1.542 1.477 | .046 .064 |
| History Number of Teachers | 16.820 | 29 | .580 | 1.910 | .005 | |
| Languages Number of Teachers | 130.636 | 29 | 4.505 | 2.251 | .001 | |
| Intercept | Religion Number of Teachers | 162.769 | 1 | 162.769 | 211.504 | .000 |
| Arabic Number of Teachers | 428.307 | 1 | 428.307 | 232.776 | .000 | |
| English Number of Teachers | 324.028 | 1 | 324.028 | 257.304 | .000 | |
| Math Number of Teachers | 223.122 | 1 | 223.122 | 182.577 | .000 | |
| Physics Number of Teachers | 15.799 | 1 | 15.799 | 46.832 | .000 | |
| Chemistry Number of Teachers | 14.174 | 1 | 14.174 | 52.665 | .000 | |
| Biology Number of Teachers | 18.808 | 1 | 18.808 | 78.212 | .000 | |
| Geology Number of Teachers | 3.794 | 1 | 3.794 | 26.926 | .000 | |
| Computer Number of Teachers | 56.346 | 1 | 56.346 | 74.516 | .000 | |
| Geography Number of Teachers | 29.096 | 1 | 29.096 | 67.248 | .000 | |
| History Number of Teachers | 16.984 | 1 | 16.984 | 55.938 | .000 | |
| Languages Number of Teachers | 12.241 | 1 | 12.241 | 6.117 | .014 | |
| Total | Religion Number of Teachers | 679.000 | 229 | |||
| Arabic Number of Teachers | 1645.000 | 229 | ||||
| English Number of Teachers | 1285.000 | 229 | ||||
| Global Journal of Management | Math Number of Teachers Physics Number of Teachers Chemistry Number of Teachers Biology Number of Teachers Geology Number of Teachers Computer Number of Teachers Geography Number of Teachers History Number of Teachers Languages Number of Teachers | 919.000 131.000 97.000 91.000 43.000 337.000 199.000 133.000 612.000 | 229 229 229 229 229 229 229 229 229 | |||
| c) Relationship between Overall Students Performance | i. ANOVA Test -Overall Performance over Teaching- | |||||
| Capacity of Teaching-organizational, Capacity of | organizational Capacity and Qualitative Inputs of | |||||
| Quality of Education & Other Entities and | Supply | |||||
| In order to test the hypothesis that lack of preparedness is affected by lack of Teaching-organizational, Capacity & capacity in Quality of the supply of the Teaching Environment, the following | Further analysis was carried out to investigate the effect of capacity of Teaching-organizational, Capacity & capacity in | |||||
| statistical Multi-level Analysis were carried out. | ||||||
| Variable | Sum of Squares | Df | Mean Square | F | Sig. | |
| Students' Gender | 37.657 | 29 | 1.299 | 1.767 | .013 | |
| School Education Level | 31.945 | 29 | 1.102 | 1.358 | .115 | |
| Instructional | 4.683 | 29 | .161 | 1.089 | .354 | |
| Structural | 7.945 | 29 | .274 | 1.083 | .361 | |
| Staff Frustration | 31.143 | 29 | 1.074 | 1.305 | .148 | |
| Positive Classroom Environment | 23.126 | 29 | .797 | 1.397 | .096 | |
| Caring & Support for Students | 19.313 | 29 | .666 | 1.675 | .022 | |
| Formalization | 7.232 | 29 | .249 | .932 | .570 | |
| Students Control | 6.264 | 29 | .216 | 1.127 | .308 | |
| Perception of Existing Pedagogy | 22.828 | 29 | .787 | 2.499 | .000 | |
| Directing Students Track | 33.989 | 29 | 1.172 | 1.250 | .188 | |
| Obstacles of Ministry Concentration | 11.213 | 29 | .387 | .636 | .926 | |
| Students Attitude | 17.750 | 29 | .612 | 2.512 | .000 | |
| Teachers Attitude | 19.962 | 29 | .688 | 2.855 | .000 | |
| Available School Services | 26.140 | 29 | .901 | 2.419 | .000 | |
| ii. | Regression Model for the Significant Teaching- | |||||
| organizational Capacity and Qualitative Inputs of | ||||||
| Supply with Overall Students Performance | ||||||
| Effect | Value | F | Hypothesis df | Error df | Sig. |
| Wilks' Lambda | |||||
| Intercept | .023 | 1146.377 | 7.000 | 193.000 | .000 |
| Perceived Students Performance -Overall Learning | .211 | 1.674 | 203.000 | 1329.011 | .000 |
| Efficacy |
| Source | Dependent Variable | Type III Sum of | df | Mean Square | F | Sig. |
| Squares | ||||||
| Corrected Model | Positive Classroom Environment | 23.126 | 29 | .797 | 1.397 | .096 |
| Caring & Support for Students | 19.313 | 29 | .666 | 1.675 | .022 | |
| Students' Gender | 37.657 | 29 | 1.299 | 1.767 | .013 | |
| Perception of Existing Pedagogy | 22.828 | 29 | .787 | 2.499 | .000 | |
| Students Attitude | 17.750 | 29 | .612 | 2.512 | .000 | |
| Teachers Attitude | 19.962 | 29 | .688 | 2.855 | .000 | |
| Available School Services | 26.140 | 29 | .901 | 2.419 | .000 |
| Students, Teachers, and Organizational Capacities' Impact on Overall Students Performance in Mafraq | |||||||
| Governorate | |||||||
| Intercept | Positive Classroom Environment | 1138.672 | 1 | 1138.672 | 1994.882 | .000 | |
| Caring & Support for Students | 1215.590 | 1 | 1215.590 | 3057.484 | .000 | ||
| Students' Gender | 289.466 | 1 | 289.466 | 393.809 | .000 | ||
| Perception of Existing Pedagogy | 1074.138 | 1 | 1074.138 | 3410.621 | .000 | ||
| Students Attitude | 1075.688 | 1 | 1075.688 | 4415.046 | .000 | ||
| Teachers Attitude | 1205.110 | 1 | 1205.110 | 4997.797 | .000 | ||
| Available School Services | 828.147 | 1 | 828.147 | 2222.817 | .000 | ||
| Total | Positive Classroom Environment | 3410.551 | 229 | ||||
| Caring & Support for Students | 3689.025 | 229 | |||||
| 2012 | Students' Gender Perception of Existing Pedagogy | 1084.000 3469.722 | 229 229 | ||||
| ear Y | Students Attitude Teachers Attitude | 3324.156 3698.247 | 229 229 | ||||
| 2 106 | Available School Services | 2678.914 | 229 | ||||
| and Business Research Volume XII Issue XIV Version I | a) Capacity of Quality of Education Evaluation -impact of implemented development program provided by the Ministry of Education and Ministry of Higher Educations by the subjects In order to realize how the relationship of overall student performance is associated with capacity of quality of education; the following analysis was extracted from the interviews with the sampled municipals: a. Evaluations of Inputs -SWOT Analysis: 1. Inputs Strength: availability of all streams; teachers specialties, capacity, skills, and cooperation; small students numbers; and available electronic pedagogy. 2. Input Weaknesses: Lack of computers; lack of parents awareness and support to intensify students' performance; hard courses in comparison to students capacity and ability; weak physical infrastructure like crowdness in some classrooms, rented buildings, and bad quality buildings; dense | 4. Threats: Students attitude; centralization; weak classroom management; escape of teachers to other professions to generate better income; decrease of students numbers in schools in favor of increasing household manpower and, therefore, income; infiltration from schools; lack of financial support for the poor; parents attitude; social structure of kinships and clans; lack of thermal control in extreme weather conditions; and lack of safe playground, school fencing, and other infrastructures. 5. Assessment of Education Economically, Socially, and culturally: should be based on reality and community understanding, as it does not fit with household needs, as well, it is not responsive to community demands and lifestyle. 6. Quality Assurance for Students & Teachers: there are gaps in teacher's performance and student's performance; exchange with students is weak; and there is lack of training in electronic education. | |||||
| Global Journal of Management | teaching schedules; dispersed school from residential settings; lack of instruments, tools, and computers in remote schools; insufficient financial and technical capacities of school; lack of experience of teachers; lack of community feedback; limited authority of teachers over students; lack of scientific majors; two teaching shifts (morning and evening) and mixed schools; travel distance for teachers and students; unqualified teachers for the first three grade levels. 3. Opportunities: Improvement of physical environment, infrastructures, facilities, gender, and educational levels. interaction with local community; separation of technical team working under municipals; stage by provide quality inputs; provision of electronic teaching; intensification of elementary intensive training for managers and teachers; equipment, buildings, and classrooms; direct and labs, | some schools suffer from lack of infrastructure and Should be based on information technology; but 10. Upgrading in Teaching and Learning Environment: do not fit market and North Badia Region needs. disturbed by geographical locations; also choices choice is inflexible, and match with needs is streams are available, but awareness is weak, 7. Distinctness to students and Teachers: is being lower but there are potentials to keep enhancing it, but infrastructure does not help and there are no incentives for both teachers and students. 8. Human Resources: Are available in full capacity and qualification but are unable to orient students energy; also it does not match with community and Badia region needs, distribution is not efficient; and limited resources and incentives for the available human resources. 9. Flexibility of Subject Choice & Job Opportunities: All | |||||
| 2012 | Variables associated with the following: (1) Teaching-Organizational Entity such as Structural, Staff |
| ear Y | Frustration, Positive Classroom Environment, and caring and support for students; (2) with quality of education |
| such as perception of existing pedagogy and directing | |
| 2 108 | student to choose a track; (3) other variables such as |
| students attitude, teachers attitude, available school | |
| services, and students gender, which supports | |
| Sergiovanni (1984), Bush (1986), Bolman & Deal (1991), | |
| Cheng (1993b), Ming (1994), and Ming & Cheong | |
| (1995). However, the following attributed affected the | |
| Perceived overall performance differently: Students' | |
| Gender, caring and support for students, perception of | |
| existing pedagogy, students' attitude, teacher's attitude, | |
| and available school services, which supports Aptekar | |
| (1983), Bates (1993), Eberts, Kehoe, & Stone (1982), | |
| Gottfredson (1985), Gregory (1992) Johnson (1990), | |
| and Stockard & Global Journal of Management | |