1.
The Impact of Individual Investor's Perceptions on Perceived Self Efficacy while Trading Internationally M.Yousaf Raza ? , Khalid Latif ? , Touqeer Sultan ? , Muhammad Bashir ? , M.Ibrar Khan ¥ & Mushtaq Ahmed § Abstract-Trends are changing and reshaping rapidly and effectively in individual and company business nationally and internationally. How to overcome financial crisis positively is a major concern? This research explains how the individual investor's insights change and constrain trading and risk enchanting behavior through the financial disaster. Examine and find how investor insights vary significantly during the crisis, with risk acceptance and risk awareness being less explosive than return outlook? During the worst months of the crisis, investors' return expectations and risk tolerance, decrease, while their risk perceptions increase. Individual investors carry on to trade actively and do not take any risk in savings portfolios during the crisis. Self usefulness pertains to optimistic thoughts to deal with the large stressors. In this way the investor can cope in all the difficulties and can solve the problems with the alternative solutions.
2. Statement of the Problem
Individual investors' perceptions change significantly throughout the crisis.
3. Research Questions
This research is conducted to find out the answer of following questions.
1. How the single investor's perceptions vary and make trading and risk taking behavior throughout the financial crisis? 2. Can all the investors solve problems they face while trading?
4. Purpose of the Study
Examine the investors' correlations of the points of and amendments in perceptions with the levels of self-efficacy and changes in the market and individual investor's income, while trading respectively.
5. Significance of the study
This study has an optimistic emotion about my financial expectations. Small and medium organization whose capital structure is suitable for their growth so they can earn more and attract investor financing by providing high return. If a benchmark for capital structure is available, then it provides guidelines for new firm as well as existing firms to gain extra return on their capital invested.
6. Objective of the Study
Objective of study is to determine the relation of individual investors' perceptions on perceived self-efficacy while trading internationally.
7. Findings
The results showed that investors and businessmen are more interested in reducing the risks when the country is in crisis. Finding is that investor perceptions diverge significantly during the crisis, with risk acceptance and risk knowledge being less unstable than return position.
8. Limitations
9. ?
This study was conducted in twin cities of Pakistan (Rawalpindi/Islamabad) due to time and budget restraints.
10. ?
Covering only financial institutes and investors.
11. ?
The sample size may be on the lower side, it is possible that if there is large sample size, results would be clearer and specified.
12. I. Introduction
n investor is a person who buys relatively small lots of stocks for his or her own collection.
He is also called a small investor or retail investor. This study shows the investors trade, attitude and behavior when he invests his stock in the international market. Self-efficacy is the degree or strength of one's belief in one's own capability to complete tasks and reach objectives. While the Perceived self efficacy is like people's thinking about their competencies to select levels of performance that work out, influence over events that affect their lives. Self efficacy beliefs establish how people feel, think, inspire themselves and behave. Such beliefs produce these miscellaneous effects through four major processes. They include cognitive, motivational, emotional and selection processes.
The Campbell Shiller model describes the dividend price ratio to a present value of predictable future profits and outlook dividend growth rates, high prices should ultimately be followed by high future dividends, low future returns or some mixture of the two ( Jiang & Lee, 2007). All the other VAR (value at risk) models use different attitudes to check the distribution of the returns (Dias, 2013). A constructive risk and return exchange is an essential rule of finance, and there is a continuing dispute about whether such a tradeoff is appropriate for company specific or individual risk (Guo & Qiu, 2014). For continual volatility, one would expect a normal distribution for stock returns. However, as is clear, the normal distribution is not a good fit. On the other hand, the stochastic volatility model specifies that it is the ratio of stock return to volatility that should be normal ( Max & Serota, 2014). A return test checks that firms in the lowest forward E/P ratio portfolio earn the lowest returns in the following two years, and a longshort investment strategy based on the forward E/P ratio creates knowingly positive abnormal returns ( Wu, 2014). The number of returned products is often stochastic, demanding estimates for several application areas, such as inventory management and remanufacturing planning (Krapp, Nebel, & Ramin Sahamie, 2013). The profits are calculated in the orientation currency and in surplus of the risk free rate, which communicates to the short term deposit rate denominated in the locus money (Santis & rard, 1998).
Educated and experienced top management may have high risk tolerance level because they are selfassured of their ability to analyze the outcome of their strategic decisions (B.T, Ariffin, A.N, Saini, & W.N.W, 2013). Many variables, with resources, practice variation, and risk tolerance, need to be considered (Wiler, et al., 2009). Cost based procedures give confidence mismatched client agency values based on lack of objectivity, risk tolerance or unfounded customer agency transforms in advertising products . Some life cycle funds focus on levels of risk tolerance, proposing conservative, moderate and aggressive portfolios (Davis, 2006).
Risk perception may vary depending on cultural, geographic, and behavioral habits. Knowledge of these population characteristics may be important when scheming educational programs for prevention (Guardia, Lopez, Salmeron, S. Pose, & Modejar, 2014). Workplace assurance and ecological righteousness issues are often focused around insights of increased risk due to unpleasant odors. Factors known to supplement risk perception comprise (Paustenbach & Gaffney, 2006). Risk perception and disease related worries may be measured through illness perceptions. The growth of interventions targeting illness perceptions may provide tools for genetic counseling ( van Hulsteijn, Kaptein, Louisse, Biermasz, A. Smit, & M. Corssmit, 2014). It is argued that risk awareness is more important for behaviors that donate to the lessening of a health threat, they are less prone to external pressures, and are easier to perform than for compound behaviors such as exercise and well eating habits (Catrinel Craciun, Schuz, Lippke, & Schwarzer, 2010). Risk insight may be more easily predisposed in low versus high populations and this should be considered in the design of clinical interference and potentially mass media movements seeking to influence risk of care behavior on child health with ethnic and cultural minorities (Wagener, Busch, Dunsiger, Chiang, & Borrell, 2014). The reality is that risk perception may be powerfully inclined by the situation in which the individuals are, when they take their conclusions (Ele Cohen, Etner, & Jeleva, 2008).
Perceived self efficacy can be stated as peoples' judgments of their competencies to arrange and implement courses of action required in managing selected types of performances.
13. II. Literature Review a) Individual investor
Mostly individual investor's EPS, reports periodically by corporations, constitute the piece of financial information mostly examined by investment proficients and individual investors equivalent (Giannetti, 2007). The noise trader model, requests that individual investor's sentimentality can have an impact on stock returns. Their findings are reliable with blast trader theory and designate that methodical trade transaction activities have incremental descriptive power for value stocks, small stocks and stocks with low institutional ownership, and stocks with lower prices. Therefore, their results support the concept that investor feeling has an important impact on stock prices (Sayim, Morris, & Rahman, 2013).
14. b) Return Expectation
Experimental research discovers that predictable excess return has a constructive relation with extra yield and book to market ratio in both cross sectional and time succession associations (Jiang & Lee, 2007). The expected return is the characteristics of the asset return sharing (Dias, 2013). Expected returns are related with revision to the instability regime and returns on total assets (Bae, Kim, & Nelson, 2007). To manage any probable effect of the level of leverage ratio on predictable returns, we execute a two measurement kind of the sample, first by the level of leverage ratio at the commencement of the previous quarter, and then by the change in leverage ratio (Cai & Zhang, 2011). Argument of Ball's, upper risk firms with higher expected returns and lower principles, can still be useful to those variables such as size (ME), leverage, and book to market equity ratio. Because these variables such as size (ME), leverage, and book to market equity ratio, are variables that extract risk and return information from prices by scaling stock prices using different methods (Lam, 2002). To split the strong association between book-to-market and expected returns requires extra magnitudes of distinction in firm parameters that lead to distinctions more strongly in one attribute than the other. A usual candidate is a firm profitability, which will be reflected in evaluation multiples without touching asset risk exposures (Johnson, Chebonenko, Cunha, Almeida, & Spencer, 2011). The intercept in the expected return model captures the expected underperformance of the Despotisms (Democracies) relative to the other docile portfolios (Core, Guay, & Rusticus, 2006). The evident realized asset return is collected of people's probable return, the instability feedback effect, and the shock to the benefit of market. So, the people's efficient expectations have a pressure on asset returns ( Huang, 2013).
15. c) Risk Tolerance
Educated and experienced top management may have high risk tolerance level because they are confident of their ability to analyze the outcome of their strategic decisions (Matemilola, B.T, Ariffin, A.N, Saini, & W.N.W, 2013). If numerous organizations are used for adjusting global fights for local addressees, there is the probability that their risk receptions will be unequal to that of their international consumers. The central global agency that owns their restricted agencies in foreign markets can guarantee more control by coordination . The long term direction provides the constant capital required for investment in employee skills and training while the adoption of core labour values may result in greater tolerance of employee voice and illustrative structures and enhanced wages and conditions up and down supply chains (Waring, 2005). One approach to dealing with these heat related restraints is to improve wheat germ to supply higher tolerance to stresses linked with these environments (Ortiz, et al., 2008). Declines in heat and cold tolerance among the elderly can be caused by chronic health conditions and poor aerobic tolerance, rather than by increased age per se (Hajat, Vardoulakis, Heaviside, & Eggen, 2014).
16. d) Risk Perception
Individual decisions in risk taking can be busted down into groups that differ in pleasant and variables that affect risk insight and risk taking, such as consciousness and controllability (Rau, Wang, & Salvendy, 2009). Studies that are based on the use of accurate numerical risk values are more probable to result in high levels of misclassified risk insights compared with those that use broader categories of risks, such as inferior than normal, average or high risk, maybe they are more cognitively challenging (Hopwood, 2000). Relationship between risk awareness and health under judgment of risk (Santos, Lourenço, & Rossi, 2011). In urban regions, risk perception reduced and dangerous behaviors continued or increased. This contrasted with increased risk perception and decreased unsafe behaviors observe in rural areas ( Barennes, Harimanana, Lorvongseng, Ongkhammy, & Chu, 2010). Risk perception and safety issues' was a companion to the session biological effects (Berry, 2003). Social location regulates both one's sense of efficacy, or personal ability to control, and outcome assessment of alternative risks, which can play a mediating role between risk perception and behavior (Lee, Su, & Hazard, 1998). Risk discernments were recorded for the same sets of threats, but with respect to an imagined state as if their birth schemes had not occurred and the renewal sites were still in a state of negligence or redundancy (or mostly so), creating a baseline position for the audit (Ayres & Thomas, 1998).
17. e) Perceived Self efficacy:
The control value theory of achievement emotions suggests that negative emotions arise when control over success is low or uncertain and positive emotions arises when control over success is high. Thus, a first critical variable in the appraisal of fear appeals is self-efficacy ( Putwain & Symes, 2014). Self efficacy is alleged to be a situational rather than a stable trait (Fisher, 2011). Self-regulation is not only directly related to supposed design success, but also indirectly, via a delicate level of self-efficacy ( Beeftink, Eerde, Rutte J, & Bertrand, 2012). Self efficacy is an examination of task necessities, e.g., an attribution analysis of past experience, the difficulty of the task; and an appraisal of the accessibility of specific resources and constraints for implementation the task (Wang & Hu, 2012).A factor that absolutely controls self-efficacy is learning by one's own knowledge (Furutani, Kobayashi, & Ura, 2009). PSE forecasts the audience of cardiac treatment, future hospitalizations, revival of function in cardiac rehabilitation and superior health position, better physical purpose and low levels of nervousness, and despair (Greco, et al., 2014). Selfefficacy appraisals reliably are influenced by contextual
18. III. Theoretical Framework
19. IV. Methodology
The methodology of this paper is based on the different variables. The variables use the model as previous study of fama and schewert (1977). The regression equation is used in it.
Y= C + ?X1 + ?X2 + ?X3 +?..+ ?Xn+ µ Y it = ? it + Return Expectation it ? 1 + Risk Tolerance it ? 2 + Risk Perception it ? 3 +µ itWhere ith are the consequences of banks with time period of t, ? it is the intercept (constant).? is the change in dependent variables with respect to change in independent variable. Where ? 1 , ? 2, ? 3 are the variables changes w.r.t time. Where µ it is the random error with the change of time.
The behavioral Consequences on E-banking show the relationship among the variables.
Y Perceived self-efficacy = f (Return Expectation, Risk Tolerance, Risk Perception).
20. a) Sampling size
It is difficult to explore the impact of three Vs, i.e. Return Expectation, Risk Tolerance, Risk Perception on general perceived self efficacy. Total employees surveyed are n=110 but the responses were 105. We administered our questionnaires to make the sample size more suitable to understand the effectiveness of investors and brokers. Rawalpindi/Islamabad are the selected for sample data in our research. In this paper, we used a simple random sampling technique.
21. b) General Profile of the Sample
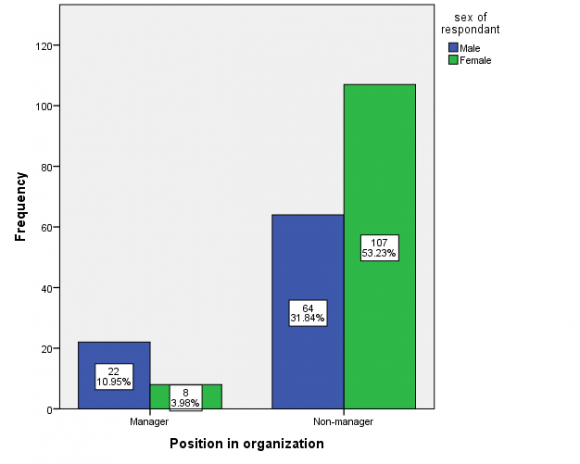
Sample was divided into four groups, Gender, Age, Education, and Experience (n=105). Table1 shows the percentage of gender; Table 1 The Impact of Individual Investor's Perceptions on Perceived Self Efficacy while Trading Internationally
22. c) Analysis and Discussion
The variables are tested with Correlation Regression and ANOVA by using SPSS Version 21.0
23. V. Reliability of Measures
Table 2 shows Cronbach's alpha reliability coefficients of one dependent variable i.e. general perceived self efficacy and other three independent variables were obtained which are as follows :-
? Return Expectation ? Risk Tolerance ? Risk PerceptionReliability test of all the variables shows the rate of Cronbach's Alpha used for all variables is more than 0.70, considered to be excellent for internal reliability of data. According to Gliem (2003) Range of Cronbach's alpha is between 0 and 1. In reliability test, .70 is acceptable value of alpha but .8 is expected to be a required target which shows a good consistency of internal scale of the items (Gliem, 2003). Reliability test with cronbach's alpha: The following rules of thumb for checking the Cronbach's Alpha is as follows:
If value of Cronbach's Alpha is >0.9, it is Excellent, If>0.8 then it is Good, if >0.7 Acceptable, >0.6 Questionable, if >0.5-Poor and If its value is <0.5, it is considered as Unacceptable" (Joseph and Gliem, 2003). 6 shows the results of ANOVA. Through ANOVA table, we concluded that our model is goodness of fit because the significant value is .033, if the sig. rate is < the level of consequence (0.05) its shows, model is goodness of fit. It also shows that at least one of the coefficients is not zero.
24. Reliability Analysis
25. VI. Regression Analysis
Regression Analysis is used to estimate the fundamental relationship between independent variables, Return Expectation, Risk Tolerance, Risk Perception and on the general, perceived self efficacy. So, we can see what amount general perceived self efficacy are dependent upon independent variables and how significant they are. In Table 5, the R-squared statistics measures success of the regression in forecasting the values of Dependent variable general perceived self efficacy with all other variables. It is the fraction of distinction in the dependent variable explained by this regression model. This model shows that R is 0.845. It shows that 83% of dependent variable is explained by its independent variables. In Table 6 the significance is not above 0.05 which proves the model used in the study is good.
26. VII. Conclusion
Results of the study will be useful for the higher management of the organizations to understand how they can perform better to develop their business where investors can better execute for their selves and for the country. We examined and found that investor's perceptions fluctuate significantly during the crisis, with risk tolerance and risk perceptions being less volatile than return expectations. This study shows the investors effectiveness with respect to return, return expectations and risk tolerance. Investors think that such behavioral studies can easily change and can provide optimistic results for future investments.

| Year | |||||||
| 28 | |||||||
| Volume XV Issue IV Version I | |||||||
| ( ) | |||||||
| Global Journal of Management and Business Research | Valid Misig | Total | Fmale Male Total Systm | Frequcy 23 82 105 20 125 F | Gender Percent 18.4 65.6 84.0 16.0 100.0 Table 1.2 : Age Percent | Valid % 21.9 78.1 100.0 Valid % | Cumulate% 21.9 100.0 Cumulate% |
| Valid | 20-25 | 5 | 4.0 | 4.8 | 4.8 | ||
| 25-30 | 5 | 4.0 | 4.8 | 9.5 | |||
| 30-40 | 25 | 20.0 | 23.8 | 33.3 | |||
| 40-50 | 56 | 44.8 | 53.3 | 86.7 | |||
| 50-60 | 14 | 11.2 | 13.3 | 100.0 | |||
| Total | 105 | 84.0 | 100.0 | ||||
| Misi.. | Systm | 20 | 16.0 | ||||
| Total | 125 | 100.0 |
| 3 : Education | |||||
| F | Percent | Valid % | Cumulate% | ||
| Valid | Matric | 17 | 13.6 | 16.2 | 16.2 |
| Interme.. | 18 | 14.4 | 17.1 | 33.3 | |
| Bachelor | 57 | 45.6 | 54.3 | 87.6 | |
| Master | 8 | 6.4 | 7.6 | 95.2 | |
| MS/PhD | 5 | 4.0 | 4.8 | 100.0 | |
| Total | 105 | 84.0 | 100.0 | ||
| Missi. | System | 20 | 16.0 | ||
| Total | 125 | 100.0 | |||
| Table 1.4 : Experience | |||||
| F | Percent | Valid % | Cumulate% | ||
| Valid | 1-5 | 55 | 44.0 | 52.4 | 52.4 |
| 10-15 | 34 | 27.2 | 32.4 | 84.8 | |
| 15-20 | 11 | 8.8 | 10.5 | 95.2 | |
| 20-30 | 5 | 4.0 | 4.8 | 100.0 | |
| Total | 105 | 84.0 | 100.0 | ||
| Misg. | Systm | 20 | 16.0 | ||
| Total | 125 | 100.0 | |||
| Coefficients | Cronbach's ? |
| RE | 0.764 |
| RT | 0.692 |
| RP | 0.841 |
| Descriptive Statistics: Measuring Mean and Standard | |
| deviation | |
| In descriptive statistics, means and standard | |
| deviations were inspected for dependent and | |
| independent variables. The consequences are shown | |
| inTable3. | |
| N | Mini.. | Maxi.. | Mean | Std. Devi.. | |
| GPS | 105 | 3.40 | 5.00 | 4.0790 | .33331 |
| RE | 105 | 2.40 | 5.00 | 3.7276 | .54991 |
| RT | 105 | 2.50 | 5.00 | 3.9405 | .66554 |
| RP | 105 | 2.50 | 5.00 | 3.8738 | .53047 |
| Valid N | 105 |
| GPS | RE | RT | RP | ||
| GPS | Pearson Corre.. | 1 | .764 ** | .692 ** | .841 ** |
| Sig. (1-tailed) | .000 | .000 | .000 | ||
| N | 105 | 105 | 105 | 105 | |
| RE | Pearson Corre. | .764 ** | 1 | .908 ** | .931 ** |
| Sig. (1-tailed) | .000 | .000 | .000 | ||
| N | 105 | 105 | 105 | 105 | |
| RT | Pearson Corre.. | .692 ** | .908 ** | 1 | .818 ** |
| Sig. (1-tailed) | .000 | .000 | .000 | ||
| N | 105 | 105 | 105 | 105 | |
| RP | Pearson Corre.. | .841 ** | .931 ** | .818 ** | 1 |
| Sig. (1-tailed) | .000 | .000 | .000 | ||
| N | 105 | 105 | 105 | 105 | |
| **. Correlation is significant at the 0.01 level (1-tailed). | |||||
| a) Multiple Regression Analysis | |||||
| M | R | R 2 | Adjust R 2 | Std.Error | Change Statistics | ||||
| R 2 | F | df1 | df2 | Sig.F | |||||
| 1 | .845 a | .715 | .706 | .18068 | .715 | 84.302 | 3 | 101 | .000 |
| Model | SS | df | MS | F | Sig. |
| 1 Regresion | 8.257 | 3 | 2.752 | 84.302 | .000 b |
| Residual | 3.297 | 101 | .033 | ||
| Total | 11.554 | 104 | |||
| a. Dependent Variable: GPS | |||||
| b. Predictors: (Constant), RP, RT, RE | |||||
| ii. | |||||
| Year | ||||||
| 30 | ||||||
| Volume XV Issue IV Version I | ||||||
| ( ) A | ||||||
| Global Journal of Management and Business Research | Model | Unstand..Coefficients | St.Coeffi | t | Sig. | |
| B | Std. Error | ? | ||||
| 1 | Constant | 2.032 | .131 | 15.557 | .000 | |
| RE | -.187 | .123 | -.309 | -1.524 | .131 | |
| RT | .075 | .064 | .149 | 1.159 | .249 | |
| RP | .633 | .093 | 1.007 | 6.812 | .000 | |
| a. Dependent Variable: GPS | ||||||