1. Introduction
n Indonesia, aside of business ethic excuse, CSR implementation is based on the law of limited company n.40 year of 2007. As one of the BUMN (stated owned enterprises) in Indonesia, PT. Pelindo III has also implemented one of the government policy which is CSR program to increase company's environment management and to synergize with the government through their Program Kemitraan Bina Lingkungan (PKBL). Unfortunately, after 10 years of MDGs declaration, PKBL implementation is not running smooth. This is cause by not only the wide range of their operation region location, but also the complex state of society and environment they try to build. The problems faced by several manager and executor of PT. Pelindo III (Persero) is the non-existent of criteria condition making funds allocation decisions which will be given to their parents in each operation regions. As known that PT.
Pelindo III (Persero) is a stated owned enterprise that runs communication sector. They are given task, authority and responsibility to manage public harbor in seven provinces: East Java, Central Java, Bali, South Borneo, Central Borneo, East Nusa Tenggara and West Nusa Tenggara.
PT. Pelabuhan Indonesia III (Persero) that runs the core business as facilitator for port service holds the key role to assure the fluency of sea transport so by the provision of sufficient sea transportation facility, it will be able to propel and o excite economy activity of the country and society. In accordance with this role, vision and mission is being set to as a direction in achieving organization's objectives. To make the implementation of PKBL program works, research will be needed for the following goals: (1) program mapping from corporation operation regional based on criteria consideration; company reputation, conflict potency, income contribution, manpower absorption, business opportunity, growth of region economy, and even distribution, (2) decision making of funds allocation based on set criteria, (3) deciding the amount of PKBL funds allocation just like the priority scale and needs based on existing criteria. All of these are expected to help succeeding government's policies in increasing pro poor, pro growth, pro job and pro environment.
2. II.
3. Literature Study
At the end of the 20th century, CSR study has been getting massive attention from all circle and society. The Earth summit that was conducted in 1992 in Rio de Jenairo , Brazil, has agreed the change of development paradigm from economy development into sustainable development, basing on the protection of the environment, economy and social development as an obligation.
A big step in CSR context was done by Elkington (1997) through 3P (Profit, People, Planet) concept in 1998. This concept has a purpose that company responsibility is not limited to collecting profit but also to give positive contribution for the people and actively protecting the planet itself. The World Business council for Sustainable Development (WBCSD) is an international institution with multinational companies as their member that defines CSR as an action based on ethical consideration directed to increase economy as well as to increase the quality of life for employees and their families and also to increase the quality of life of society in surroundings and in wider sense (WBCSD, 2005).
WBCSD meeting in New York (2005) has created an agreement that CSR practice is a form of business world commitment to help UNO in implementing MDGs target. In Indonesia, other than ethical business matter, CSR implementation is base on the law of limited company N.40 year of 2007 on Limited Company chapter IV section 66 verse 2b and chapter V section 74 verse 1 explaining that company's annual report should reflect social responsibility. Even though government cannot change the direction for corporation CSR policies related to CSR connectivity with core business of a company, every program can be directed to achieve government's target in order to fulfill MDGs (Millenium Development Goals) achievement commitment in 2015.
The rationale for a more civilized corporation has already surfaced for quite some time as one of the voluntary approach placed in beyond compliance level. The implementation of CSR nowadays has a rapid development in Indonesia as a business response in seeing environment and social response aspect as an opportunity to increase their competitive quality as well as a part for risk management for their business sustainability. CSR implementation in Indonesia was existed in early 2000s, even though activities with the same essence has already implemented way back in 1970s with a variety of level, starting from the simplest such as donation to integration of business operation (Sumardiyono, 2007). In fact, CSR promotion in Indonesia has been marked by government's initiative and privates' (Uriarte, 2008). This means that CSR is well accepted. In Indonesia, companies are categorized into several stages; (1) most companies are in subservience stage in which they adopted policy-based compliance business working cost, (2) managerial stage, where they pay attention on social problems in their core management process, (3) several companies are in strategic steps, where companies integrating social issue into their core business strategy (Uriarte, 2008).
Partnership principle is actively requiring companies to work together with the society, central government, local authorities, and other related parties to achieve collective commitment based on trust and openness. All of this aims to achieve agreed goals and collective involvement. Companies work together with government, organization and other public institution in formulating partnership policies with the society just as participating in dialogue with said institutions to expect that rational and effective policies can be wellformulated. Companies are very respectful for every partnership activity that contributes to society and increasing company's social value.
In relation to environmental aspect, by modification from Program Penilaian Peringkat Kinerja Perusahaan (PROPER) there are four levels set by the ministry of environment: (1) black, this means companies run their business merely for their own sake and do not care for their surroundings, be it social or environmental aspect, (2) red, this means companies have the tendency to exploit resources more than what ecology, social and economy can support and collectively creating negative impact in regional and global level, (3) blue, this means companies take CSR to give positive impact for their businesses because CSR is seen as an investment and not as cost and (4) honeybee or green, which places CSR as core strategy and the heart of their business. CSR is not only a requirement but also a need for a company. Companies in this level believe that a business will sustain if they are having social capital aside of financial capital. PROPER is incentive and disincentive-based environmental control. This means that the announcement of PROPER attendants with green, blue, red and black is known by society, it will give an effect for their image just as their level. PROPER is an innovation in controlling contamination in industrial sector (Sumardiyono, 2007).
Moreover, based on many literature consideration and empirical studies as well as focus group discussion, funds allocation mapping and PKBL in PT. Pelindo III (Persero) has agreed on seven criteria. This considers statements from several experts and findings from several empirical researches. Tilt (1994) stated that stakeholders pressure influences CSR exposure, forming corporate image (Branco & Rodriguez, 2006;Cerin, 2002;Fombrun & Shanley, 1990), Juholin (2005), and also influencing or influenced by organization's objectives achievement (Moir, 2001). Choi, et al. (2010) considers physical environment and social factors. While Dowling & Pfeffer (1975) added that a company needs to own a legitimate strategy that can be adopted when they are facing hardships on their legitimacy or when they see gaps in their legitimacy. There is a contradiction however that CSR can be seen as business orientation (Silberhorn & Warren, 2007). By this, PT. Pelindo III (Persero) needs to consider company's reputation aspect as well as conflict potency, income contribution, manpower absorption, business opportunity, region economy growth and even distribution.
4. III.
5. Research Methodology
Methods used in this study is survey method which is by giving away questionnaire to managers and the implementers of PKBL PT. Pelindo III (Persero) on seven provinces in Indonesia. The type of this research is descriptive research because it was meant to obtain the description on (1) program mapping from corporation operation region is 9 PKBL distributor branches based on the criteria of company reputation, conflict potency, income contribution, manpower absorption, business opportunity, region economy growth, and event distribution, (b) decision making of funds allocation based on set criteria, (2) determining the amount of PKBL based on priority scale and needs based on set criteriawith the result of this study, it is hoped that there will be a built data and information system as a foundation for strategic planning of PKBL PT. Pelindo III (Persero) to help local authority in formulating many development policies in regions. The population is all managers and implementers staff PKBL PT. Pelindo III (Persero) from seven provinces in Indonesia. Sample used in this research is part of population with relative characteristics and is considered able to represent the population. Sampling technique used in this study is stratified random sampling which is a technique where the samples are taken from population by observing each stratum in population (Hair et al., 1995). The amount of samples in this study is 60 respondents originated from managers and implementers of PKBL Pt. Pelindo III (Persero) in 9 PKBL distributor branches. Statistic technique in this research is Analytical Hierarchy Process (AHP). The use of AHP is requiring logic consistency in making comparison between criteria (Anderson et al., 2005(Anderson et al., : 2003)). From consistency calculation result, it is known that value of CR < 0.10, so the comparison between criteria has fulfilled logic consistency requirement. Thus, the validity of this research's result is accountable.
6. IV.
7. Results And Discussion
This sub chapter will discuss on 60 data that has been gathered. Next is descriptive analysis with AHP technique. Just as known, PT. Pelabuhan III (Persero) is centered in Surabaya. To the day of this research was conducted, the main office still lacks the correct criteria for (1) program mapping from corporation operation region is 9 PKBL distributor branches based on the criteria of company reputation, conflict potency, income contribution, manpower absorption, business opportunity, region economy growth, and event distribution, (b) decision making of funds allocation based on set criteria, (2) determining the amount of PKBL based on priority scale and needs based on set criteria. Hence why this research is important. There are nine PKBL distributor branches of PT. Pelindo III (Persero): Tanjung Perak, Tanjung Intan, Banjarmasin, Tanjung Wangi, Benoa, Kupang, Sampit and Lembar.
8. a) Pair Wise Comparison Between Criteria
This research used two data input categories for the implementation of AHP method which is pair wise comparison matrix between criteria and pair wise comparison of each alternative for each criteria. The matrix can be seen in the following Table 1.
9. Table 1 : Matrix of Pair wise Comparison between Criteria i. Criteria Valuation
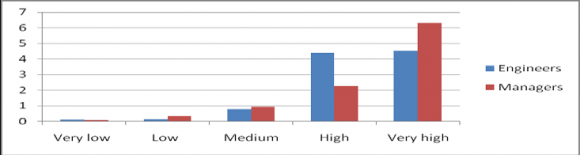
Criteria valuation is used to determine which criteria is the most significant. This is done by dividing each comparison value with total value. Data input is matrix of pair wise comparison between criteria. Matrix of value between criteria is presented in Table 2. This matrix is arranged by assuming that the amount of value from all criteria is 1 or 100%. Criteria with the highest score is the one with the highest priority. From the matrix of value between criteria, it is known that income contribution criteria received highest proportion with the value of 0.31462 or 31.46%. this shows that income contribution criteria is considered the most important/significant and with its high value (close to 50%), experience factor may also be considered as a decisive selecting factor of PKBL funds allocation. Meanwhile, manpower absorption gained the lowest value of 3.66%. After the value between criteria is known, next step is arranging matrix of relative value comparison between criteria for each PT. Pelindo III (Persero) branches. There are 9 brances with 7 criteria, so that means there are valuations on 9 alternatives and 7 criteria. This valuation focused on determining how significant each PT. Pelindo III (Persero) branches are as PKBL distributors. On a scale of 1 to 9, with 9 as the highest number showing that the branch is seen as the most able and takes the highest position to fulfill the criteria more than any other branches. The first step is by giving comparison on alternative in every criteria and then determining the value. Respectively as following: i. Reputation Tanjung Perak 0,432767 0,265823 0,375469 0,394737 0,388601 0,686275 0,233333 0,272727 0,235294 3,285026 36,50% Tanjung Emas 0,061824 0,037975 0,015019 0,02193 0,025907 0,038126 0,033333 0,015152 0,088235 0,3375 3,75% Tanjung Intan 0,086553 0,189873 0,075094 0,197368 0,07772 0,022876 0,133333 0,136364 0,147059 1,066241 11,85% Banjarmasin 0,072128 0,113924 0,025031 0,065789 0,07772 0,038126 0,1 0,227273 0,088235 0,808227 8,98% Tanjung Wangi 0,086553 0,113924 0,075094 0,065789 0,07772 0,038126 0,166667 0,045455 0,088235 0,757564 8,42% Benoa 0,072128 0,113924 0,375469 0,197368 0,233161 0,114379 0,166667 0,227273 0,205882 1,706251 18,96% Kupang 0,061824 0,037975 0,018773 0,02193 0,015544 0,022876 0,033333 0,015152 0,029412 0,256818 2,85% Sampit 0,072128 0,113924 0,025031 0,013158 0,07772 0,022876 0,1 0,045455 0,088235 0,558527 6,21% Lembar 0,054096 0,012658 0,015019 0,02193 0,025907 0,01634 0,033333 0,015152 0,029412 0,223846 2,49% Total Tanjung Perak 0,267176 0,223881 0,209302 0,314685 0,189873 0,365854 0,172414 0,2 0,333333 2,276518 25,29% Tanjung Emas 0,267176 0,223881 0,209302 0,314685 0,189873 0,121951 0,172414 0,2 0,238095 1,937377 21,53% Tanjung Intan 0,089059 0,074627 0,069767 0,034965 0,113924 0,04065 0,103448 0,12 0,142857 0,789298 8,77% Banjarmasin 0,089059 0,074627 0,209302 0,104895 0,189873 0,121951 0,103448 0,12 0,142857 1,156013 12,84% Tanjung Wangi 0,053435 0,044776 0,023256 0,020979 0,037975 0,04065 0,103448 0,04 0,015873 0,380392 4,23% Benoa 0,089059 0,223881 0,209302 0,104895 0,113924 0,121951 0,172414 0,12 0,047619 1,203045 13,37% Kupang 0,053435 0,044776 0,023256 0,034965 0,012658 0,02439 0,034483 0,04 0,015873 0,283836 3,15% Sampit 0,053435 0,044776 0,023256 0,034965 0,037975 0,04065 0,034483 0,04 0,015873 0,325413 3,62% Lembar 0,038168 0,044776 0,023256 0,034965 0,113924 0,121951 0,103448 0,12 0,047619 0,648108 7,20% Total From Table 6 and Figure 2, it is known that to fulfill manpower absorption criteria as an impact of PKBL funding, Tanjung Perak is also seen as the best branch with the value of 25.29%. Next is Tanjung Emas (21.59%) and Tanjung Benoa (13.37%) as well as Banjarmasin (12.84%). While for other branches, they are still below 10%.
1 1 1 1 1 1 1 1 1 9 11 1 1 1 1 1 1 1 1 9 1iii. Conflict Potency For conflict potency criteria, Tanjung Intan is the most vulnerable branch on conflict potency by 32.24%. This is why if conflict potency aspect is the only criteria to be considered in allocating PKBL funds, Tanjung Intan will have the biggest portion. This assessment shows that conflict potency criteria is indirectly related with two previous criteria. So that the selection from Tanjung Perak drastically change to Tanjung Intang if seen from just one criteria. While Benoa and Sampit is still very conducive so there will be non need of large PKBL funds because each of them gained low scores (2.17% and 2.72%). Tanjung Perak 0,13757 0,558087 0,079848 0,230769 0,245902 0,2 0,222615 0,25 0,235955 2,161 24,01% Tanjung Emas 0,019653 0,079727 0,13308 0,138462 0,147541 0,175 0,222615 0,15625 0,168539 1,241 13,79% Tanjung Intan 0,687848 0,23918 0,39924 0,230769 0,344262 0,175 0,371025 0,21875 0,235955 2,902 32,24% Banjarmasin 0,027514 0,026576 0,079848 0,046154 0,016393 0,075 0,024735 0,03125 0,101124 0,429 4,76% Tanjung Wangi 0,027514 0,026576 0,057034 0,138462 0,04918 0,075 0,024735 0,09375 0,101124 0,593 6,59% Benoa 0,017196 0,01139 0,057034 0,015385 0,016393 0,025 0,010601 0,03125 0,011236 0,195 2,17% Kupang 0,045857 0,026576 0,079848 0,138462 0,147541 0,175 0,074205 0,09375 0,101124 0,882 9,80% Sampit 0,017196 0,015945 0,057034 0,046154 0,016393 0,025 0,024735 0,03125 0,011236 0,245 2,72% Lembar 0,019653 0,015945 0,057034 0,015385 0,016393 0,075 0,024735 0,09375 0,033708 0,352 3,91% Total This also applies for Lembar and Banjarmasin in which only gained less than 5% value, meaning that these branches are safe. This shows that the use of PKBL in Tanjung Intan, Perak and Emas will have positive influence on conflict potency in the society. Tanjung Perak 0,353535 0,445545 0,36 0,314685 0,225806 0,294118 0,230769 0,283019 0,355932 2,86341 31,82% Tanjung Emas 0,117845 0,148515 0,12 0,314685 0,16129 0,176471 0,164835 0,169811 0,152542 1,525995 16,96% Tanjung Intan 0,117845 0,148515 0,12 0,104895 0,096774 0,176471 0,098901 0,056604 0,152542 1,072547 11,92% Banjarmasin 0,117845 0,049505 0,12 0,104895 0,096774 0,176471 0,164835 0,169811 0,152542 1,152679 12,81% Tanjung Wangi 0,050505 0,029703 0,04 0,034965 0,032258 0,019608 0,010989 0,018868 0,016949 0,253845 2,82% Benoa 0,070707 0,049505 0,04 0,034965 0,096774 0,058824 0,098901 0,169811 0,050847 0,670335 7,45% Kupang 0,050505 0,029703 0,04 0,020979 0,096774 0,019608 0,032967 0,018868 0,016949 0,326353 3,63% Sampit 0,070707 0,049505 0,12 0,034965 0,096774 0,019608 0,098901 0,056604 0,050847 0,597911 6,64% Lembar 0,050505 0,049505 0,04 0,034965 0,096774 0,058824 0,098901 0,056604 0,050847 0,536925 5,97% Tanjung Perak 0,430696 0,41112 0,461974 0,679172 0,192661 0,195822 0,2 0,223881 0,22314 3,018465 33,54% Tanjung Emas 0,086139 0,082224 0,197989 0,027167 0,192661 0,195822 0,175 0,223881 0,173554 1,354436 15,05% Tanjung Intan 0,061528 0,027408 0,065996 0,045278 0,082569 0,117493 0,175 0,223881 0,173554 0,972707 10,81% Banjarmasin 0,086139 0,41112 0,197989 0,135834 0,192661 0,195822 0,175 0,223881 0,173554 1,791999 19,91% Tanjung Wangi 0,061528 0,011746 0,021999 0,019405 0,027523 0,007833 0,075 0,014925 0,008264 0,248224 2,76% Benoa 0,086139 0,016445 0,021999 0,027167 0,137615 0,039164 0,075 0,014925 0,123967 0,542421 6,03% Kupang 0,053837 0,011746 0,009428 0,019405 0,009174 0,013055 0,025 0,014925 0,024793 0,181364 2,02% Sampit 0,086139 0,016445 0,013199 0,027167 0,082569 0,117493 0,075 0,044776 0,07438 0,537169 5,97% Lembar 0,047855 0,011746 0,009428 0,019405 0,082569 0,117493 0,025 0,014925 0,024793 0,353215 3,92% Total
10. 27%
April received bigger funds than other branches so it will automatically make them to have more experience in seeing new business potency as the effect from PKBL funds allocation in their partnership. This is not the sole possibility, other is that Tanjung Perak is in the second biggest city in Indonesia so it is possible for them to have more business opportunities than other branches. 6, it is known that based on region economic growth opportunity criteria, Tanjung Perak is the best option with 30% value followed by Banjarmasin (20.12%) and Tanjung Emas (14.9%). Other branches scored lower than 12% which means there are very small amount of PKBL contribution in these branches for region economic growth.
11. Perak
Assessment value close to 50& shows that by allocating PKBL in Tanjung Perak will be trust that there will be more business opportunity to surface as business development of PT. Pelindo III (Persero). This is possible if based on the fact that Tanjung Perak is tested in knowing company's external condition more than other branches so they have the best possibility in getting more opportunities. Tanjung Perak 0,355781 0,350195 0,238095 0,522388 0,189189 0,211268 0,203883 0,376884 0,252632 2,700316 30,00% Tanjung Emas 0,118594 0,116732 0,142857 0,058043 0,135135 0,211268 0,145631 0,226131 0,189474 1,343864 14,93% Tanjung Intan 0,071156 0,038911 0,047619 0,034826 0,081081 0,023474 0,087379 0,025126 0,094737 0,504308 5,60% Banjarmasin 0,118594 0,350195 0,238095 0,174129 0,189189 0,211268 0,145631 0,226131 0,157895 1,811126 20,12% Tanjung Wangi 0,050826 0,023346 0,015873 0,024876 0,027027 0,023474 0,009709 0,015075 0,010526 0,200732 2,23% Benoa 0,118594 0,038911 0,142857 0,058043 0,081081 0,070423 0,145631 0,025126 0,094737 0,775402 8,62% Kupang 0,050826 0,023346 0,015873 0,034826 0,081081 0,014085 0,029126 0,015075 0,010526 0,274765 3,05% Sampit 0,071156 0,038911 0,142857 0,058043 0,135135 0,211268 0,145631 0,075377 0,157895 1,036272 11,51% Lembar 0,044473 0,019455 0,015873 0,034826 0,081081 0,023474 0,087379 0,015075 0,031579 0,353215 3,92% Total
12. 33%
13. vi. Region Economic Growth Opportunity
There is a possibility that because Tanjung Perak has already received bigger funds than other branches so it will automatically make them to have more experience in growing region economic as the effect from PKBL funds allocation in their partnership. This is not the sole possibility, other is that Tanjung Perak is in the second biggest city in Indonesia so the multiplier effect from PKBL funds implementation higher than any other branches. This notion is supported by the data that all other branches is not placed in cities where the industrial area is not as advanced as Surabaya. Assessment value close to 50% shows that by allocating PKBL in Tanjung Perak will influence region economic growth faster and more effective than other branches. This is probably based on criteria of region economic which is business opportunity where Tanjung Perak got the highest value, this means Tanjung Perak has the highest value as well for this criteria than other branches. Tanjung Perak 0,030303 0,015873 0,008499 0,014085 0,022901 0,022222 0,061224 0,027027 0,034483 0,237 2,63% Tanjung Emas 0,090909 0,047619 0,127479 0,014085 0,038168 0,2 0,061224 0,027027 0,034483 0,641 7,12% Tanjung Intan 0,151515 0,015873 0,042493 0,126761 0,022901 0,022222 0,102041 0,027027 0,034483 0,545 6,06% Banjarmasin 0,090909 0,142857 0,014164 0,042254 0,038168 0,022222 0,061224 0,027027 0,034483 0,473 5,26% Tanjung Wangi 0,151515 0,142857 0,212465 0,126761 0,114504 0,2 0,102041 0,243243 0,057471 1,351 15,01% Benoa 0,090909 0,015873 0,127479 0,126761 0,038168 0,066667 0,102041 0,081081 0,057471 0,706 7,85% Kupang 0,151515 0,238095 0,127479 0,211268 0,343511 0,2 0,306122 0,243243 0,517241 2,338 25,98% Sampit 0,090909 0,142857 0,127479 0,126761 0,038168 0,066667 0,102041 0,081081 0,057471 0,833 9,26% Lembar 0,151515 0,238095 0,212465 0,211268 0,343511 0,2 0,102041 0,243243 0,172414 1,875 20,83% This phenomenon happends because there are many programs used by Tanjung Perak so event distribution I needed for other branches especially if they are serving ship.
14. Conclusion
The seven criteria can be used as corporate consideration in decision making for program mapping from corporate operation region based on the criteria of: company reputation, conflict potency, income contribution, manpower absorption, business opportunity, region economic growth, even distribution and decision making of funds allocation based on set criteria.
15. VI.
16. Suggestion
This research recommends stated owned enterprises in indonesia to base their funds allocation and PKBL programs on beneficial criteria for stakeholders PKBL funds allocation pattern must be appropriate with priority and need scales from stakeholders perception To gain legitimacy, company may explain their PKBL activity into their annual reports and other company's documents to form corporate image (Branco & Rodrigues, 2006;Cerin, 2002) and to ensure their stakeholders through national/regional/local media such as publicity, social activity, official website and other supporting activy. Abbot & Monsen (1979)
17. Limitation
This research is a case study research, hence there are few limitations: (1) the result used primary data with perception measurement, and also originated from one company, (2) this research suffers bias in data interpretation and presenting facts because of author's subjectivity.

| b) Comparison Of Relative Value Between The |
| Alternatives For Each Criterion |
| Criteria | Reputattion | Manpower absorption | Conflict Potency | Branch Income contribution | Branch opportunity business | Growth Region Economic | Distributiion | Total | Mean | |||||
| Reputation | 0,064378 | 0,2 | 0,483871 | 0,021097 | 0,011407 | 0,098039 | 0,057471 | 0,93626 | 0,13375 | |||||
| Manpower | ||||||||||||||
| absorption | 0,012876 | 0,04 | 0,053763 | 0,021097 | 0,019011 | 0,098039 | 0,011494 | 0,25628 | 0,03661 | |||||
| Conflict potency | 0,021459 | 0,12 | 0,16129 | 0,738397 | 0,171103 | 0,098039 | 0,172414 | 1,48270 | 0,21181 | |||||
| Branch Income | ||||||||||||||
| Contribution | 0,450644 | 0,28 | 0,032258 | 0,147679 | 0,39924 | 0,490196 | 0,402299 | 2,20232 | 0,31462 | |||||
| Branch | ||||||||||||||
| Opportuniy business | 0,321888 | 0,12 | 0,053763 | 0,021097 | 0,057034 | 0,098039 | 0,011494 | 0,68332 | 0,09762 | |||||
| Region Economic | ||||||||||||||
| Growth | 0,064378 | 0,04 | 0,16129 | 0,029536 | 0,057034 | 0,098039 | 0,287356 | 0,73763 | 0,10538 | |||||
| Distribution | 0,064378 | 0,2 | 0,053763 | 0,021097 | 0,285171 | 0,019608 | 0,057471 | 0,70149 | 0,10021 | |||||
| 1 | 1 | 1 | 1 | 1 | 1 | 1 | 7,00000 | 1,00000 | ||||||
| Reputation | Tanjung | Tanjung Emas | Tanjung Intan | Banjarmas in | Tanjung Wangi | Benoa | Kupang Sampit | Lembar | ||||||
| Tanjung Perak | 1 | 7 | 5 | 6 | 5 | 6 | 7 | 6 | 8 | |||||
| Tanjung Emas 0,142857143 | 1 | 0,2 | 0,333 | 0,33333333 0,33333333 | 1 | 0,33333333 | 3 | |||||||
| Tanjung Intan | 0,2 | 5 | 1 | 3 | 1 | 0,2 | 4 | 3 | 5 | |||||
| Banjarmasin | 0,166666667 | 3 | 0,3333333 | 1 | 1 | 0,33333333 | 3 | 5 | 3 | |||||
| Tanjung Wangi | 0,2 | 3 | 1 | 1 | 1 | 0,33333333 | 5 | 1 | 3 | |||||
| Benoa | 0,166666667 | 3 | 5 | 3 | 3 | 1 | 5 | 5 | 7 | |||||
| Kupang | 0,142857143 | 1 | 0,25 | 0,3333333 | 0,2 | 0,2 | 1 | 0,33333333 | 1 | |||||
| Sampit | 0,166666667 | 3 | 0,3333333 | 0,2 | 1 | 0,2 | 3 | 1 | 3 | |||||
| Lembar | 0,125 | 0,333333333 | 0,2 | 0,3333333 0,33333333 0,14285714 | 1 | 0,33333333 | 1 | |||||||
| Total | 2,310714286 26,33333333 13,316667 | 15,2 12,8666667 8,74285714 | 30 | 22 | 34 | |||||||||
| Reputatiton | Tanjung Perak | Tanjung Emas | Tanjung Intan | Banjarma sin | Tanjung Wangi | Benoa | Kupang Sampit Lembar Jumlah | mean | ||||||
| ii. Manpower Absorption |
| Reputation | ||||||||||
| 19% | 3% | 6% 2% | 37% | Tanjung Perak Tanjung Emas Tanjung Intan | ||||||
| Banjarmasin | ||||||||||
| Tanjung Wangi | ||||||||||
| Benoa | ||||||||||
| 8% | 9% | 12% | 4% | Kupang Sampit Lembar | ||||||
| Manpower absorption | Tanjung | Tanjung Emas | Tanjung Intan | Banjarmas in | Tanjung Wangi | Benoa | Kupang | Sampit | Lembar | |
| Tanjung Perak | 1 | 1 | 3 | 3 | 5 | 3 | 5 | 5 | 7 | |
| Tanjung Emas | ||||||||||
| iv. Income Contribution | |||||||||||
| Total | 1 | 1 | 1 | 1 | 1 | 1 | 1 | 1 | 1 | 9 | 1 |
| Tanjung Perak | |||||||||||
| Tanjung Emas | |||||||||||
| Tanjung Intan | |||||||||||
| Banjarmasin | |||||||||||
| Tanjung Wangi | |||||||||||
| Benoa | |||||||||||
| Kupang | |||||||||||
| Sampit | |||||||||||
| Lembar | |||||||||||
| This notion is understandable because the |
| portion is close to 50%, while other branches is far |
| behind. Even for 5 branches, they arestill below 10%: |
| Tanjung Wangi, Benoa, Kupang, Sampit and Lembar. |
| v. Branch Business Opportunity |
| Tanjung Perak is seen as the best option with |
| 33.54% value. Next is Banjarmasin (19.9%), Tanjung |
| Emas (15.05%) and Tanjung Intan (10.81%). There is a |
| possibility that because Tanjung Perak has already |
| Distribu | Tanjung | Tanjung Emas | Tanjung Intan | Banjarmas in | Tanjung Wangi | Benoa | Kupang | Sampit | Lembar | ||||
| Tanjung Perak | 1 | 0,333333333 | 0,2 | 0,3333333 | 0,2 | 0,33333333 | 0,2 | 0,33333333 | 0,2 | ||||
| Tanjung Emas | 3 | 1 | 3 | 0,3333333 0,33333333 | 3 | 0,2 | 0,33333333 | 0,2 | |||||
| Tanjung Intan | 5 | 0,333333333 | 1 | 3 | 0,2 | 0,33333333 0,333333 0,33333333 | 0,2 | ||||||
| Banjarmasin | 3 | 3 | 0,3333333 | 1 | 0,33333333 0,33333333 | 0,2 | 0,33333333 | 0,2 | |||||
| Tanjung Wangi | 5 | 3 | 5 | 3 | 1 | 3 | 0,333333 | 3 | 0,333333 | ||||
| Benoa | 3 | 0,333333333 | 3 | 3 | 0,33333333 | 1 | 0,333333 | 1 | 0,333333 | ||||
| Kupang | 5 | 5 | 3 | 5 | 3 | 3 | 1 | 3 | 3 | ||||
| Sampit | 3 | 3 | 3 | 3 | 0,33333333 | 1 | 0,333333 | 1 | 0,333333 | ||||
| Lembar | 5 | 5 | 5 | 5 | 3 | 3 | 0,333333 | 3 | 1 | ||||
| Total | 33 | 21 23,533333 23,666667 8,73333333 | 15 3,266667 12,3333333 | 5,8 | |||||||||
| Distribution | Tanjung Perak | Tanjung Emas | Tanjung Intan | Banjarma sin | Tanjung Wangi | Benoa | Kupang Sampit Lembar Total | mean | |||||
| tion | Perak | |||||||||||
| April | ||||||||||||
| Total | 1 | 1 | 1 | 1 | 1 | 1 | 1 | 1 | 1 | 9 | 1 | |
| 9% | 3% | 11% | 4% | 30% | Tanjung Perak Tanjung Emas Tanjung Intan | |||||||
| Banjarmasin | ||||||||||||
| 2% | 20% | Tanjung Wangi Benoa | ||||||||||
| 15% | Kupang | |||||||||||
| 6% | Sampit Lembar | |||||||||||
| Figure 4.6 : PKBL Allocation Funds based on region economic growth | ||||||||||||
| Distribution | |||||||||
| 9% | 21% | 3% 7% 6% 5% | Tanjung Perak Tanjung Emas Tanjung Intan Banjarmasin | ||||||
| 26% | 15% | Tanjung Wangi Benoa | |||||||
| 8% | Kupang Sampit | ||||||||
| Lembar | |||||||||
| Keterangan | reputation | Manpower absorption | Conflict Potency | Contibution Income | business Branch Opportunity | growth Region economic | Distribution | Total | Mean |
| Tanjung Perak | 0,3417 | 0,0648 | 0,3560 | 0,7007 | 0,2292 | 0,2213 | 0,0184 | 1,9321 | 27,60% |
| Tanjung Emas | 0,0351 | 0,0552 | 0,2044 | 0,3734 | 0,1028 | 0,1101 | 0,0500 | 0,9311 | 13,30% |
| Tanjung Intan | 0,1109 | 0,0225 | 0,4781 | 0,2625 | 0,0739 | 0,0413 | 0,0425 | 1,0316 | 14,74% |
| Banjarmasin | 0,0841 | 0,0329 | 0,0706 | 0,2821 | 0,1361 | 0,1484 | 0,0369 | 0,7911 | 11,30% |
| Tanjung Wangi | 0,0788 | 0,0108 | 0,0978 | 0,0621 | 0,0188 | 0,0165 | 0,1053 | 0,3901 | 5,57% |
| Benoa | 0,1775 | 0,0343 | 0,0322 | 0,1640 | 0,0412 | 0,0636 | 0,0551 | 0,5678 | 8,11% |
| Kupang | 0,0267 | 0,0081 | 0,1454 | 0,0799 | 0,0138 | 0,0225 | 0,1823 | 0,4786 | 6,84% |
| Sampit | 0,0581 | 0,0093 | 0,0404 | 0,1463 | 0,0408 | 0,0849 | 0,0650 | 0,4447 | 6,35% |
| Lembar | 0,0233 | 0,0185 | 0,0579 | 0,1314 | 0,0268 | 0,0289 | 0,1461 | 0,4329 | 6,18% |
| Total | 0,9363 | 0,2563 | 1,4827 | 2,2023 | 0,6833 | 0,7376 | 0,7015 | 7,0000 | |